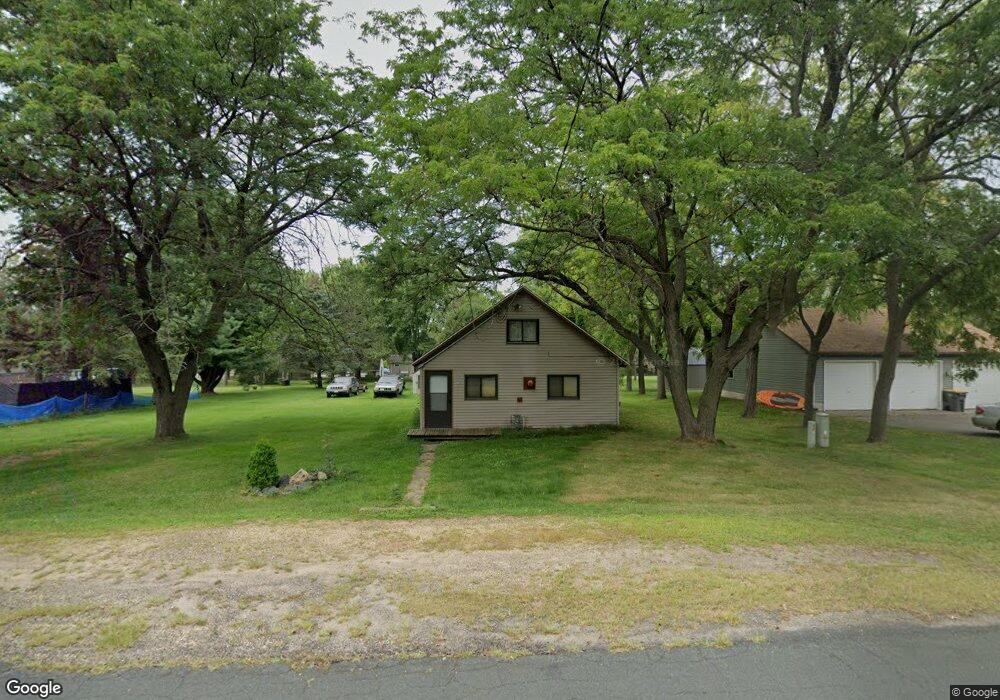
855 Norton St Hammond, WI 54015
Estimated Value: $180,739 - $257,000
2
Beds
1
Bath
--
Sq Ft
0.99
Acres
About This Home
This home is located at 855 Norton St, Hammond, WI 54015 and is currently estimated at $211,935. 855 Norton St is a home located in St. Croix County with nearby schools including Saint Croix Central Elementary School, Saint Croix Central Middle School, and St. Croix Central High School.
Ownership History
Date
Name
Owned For
Owner Type
Purchase Details
Closed on
Sep 10, 2007
Sold by
The Bank Of New York Trust
Bought by
Vanvleet Armand D
Current Estimated Value
Home Financials for this Owner
Home Financials are based on the most recent Mortgage that was taken out on this home.
Original Mortgage
$70,300
Interest Rate
6.55%
Mortgage Type
New Conventional
Purchase Details
Closed on
May 15, 2007
Sold by
Slinker Debbie M
Bought by
Bank Of New York Trust Co Na
Purchase Details
Closed on
Sep 20, 2006
Sold by
Slinker David A
Bought by
Slinker Debbie M
Purchase Details
Closed on
Aug 26, 2004
Sold by
Slinker Debbie M and Pittman Debbie M
Bought by
Slinker David A and Slinker Debbie M
Home Financials for this Owner
Home Financials are based on the most recent Mortgage that was taken out on this home.
Original Mortgage
$91,000
Interest Rate
6.12%
Mortgage Type
Adjustable Rate Mortgage/ARM
Create a Home Valuation Report for This Property
The Home Valuation Report is an in-depth analysis detailing your home's value as well as a comparison with similar homes in the area
Home Values in the Area
Average Home Value in this Area
Purchase History
| Date | Buyer | Sale Price | Title Company |
|---|---|---|---|
| Vanvleet Armand D | -- | None Available | |
| Vanfleet Armand D | $74,000 | None Available | |
| Bank Of New York Trust Co Na | -- | None Available | |
| Slinker Debbie M | -- | None Available | |
| Slinker David A | -- | None Available |
Source: Public Records
Mortgage History
| Date | Status | Borrower | Loan Amount |
|---|---|---|---|
| Previous Owner | Vanfleet Armand D | $70,300 | |
| Previous Owner | Slinker David A | $91,000 |
Source: Public Records
Tax History Compared to Growth
Tax History
| Year | Tax Paid | Tax Assessment Tax Assessment Total Assessment is a certain percentage of the fair market value that is determined by local assessors to be the total taxable value of land and additions on the property. | Land | Improvement |
|---|---|---|---|---|
| 2024 | $18 | $95,000 | $49,700 | $45,300 |
| 2023 | $1,713 | $95,000 | $49,700 | $45,300 |
| 2022 | $1,526 | $95,000 | $49,700 | $45,300 |
| 2021 | $1,552 | $95,000 | $49,700 | $45,300 |
| 2020 | $1,251 | $95,000 | $49,700 | $45,300 |
| 2019 | $1,220 | $61,300 | $35,700 | $25,600 |
| 2018 | $1,240 | $61,300 | $35,700 | $25,600 |
| 2017 | $1,234 | $61,300 | $35,700 | $25,600 |
| 2016 | $1,234 | $61,300 | $35,700 | $25,600 |
| 2015 | $1,316 | $61,300 | $35,700 | $25,600 |
| 2014 | $1,284 | $61,300 | $35,700 | $25,600 |
| 2013 | $1,226 | $61,300 | $35,700 | $25,600 |
Source: Public Records
Map
Nearby Homes
- 1685 178th St Dalton Farm Road Lot 25
- 1110 Eulaine Cir
- 792 186th St
- 1415 Meadows Dr
- 415 Johnson Pkwy
- 754 190th St
- 988 County Road T
- 747 165th Ave
- 720 165th St
- 745 165th St
- 747 165th St
- 1643 75th Ave
- 1639 75th Ave
- 1613 75th Ave
- 1637 75th Ave
- 1635 75th Ave
- 729 163rd St
- 727 163rd St
- 1637 72nd Ave
- 1632 72nd Ave