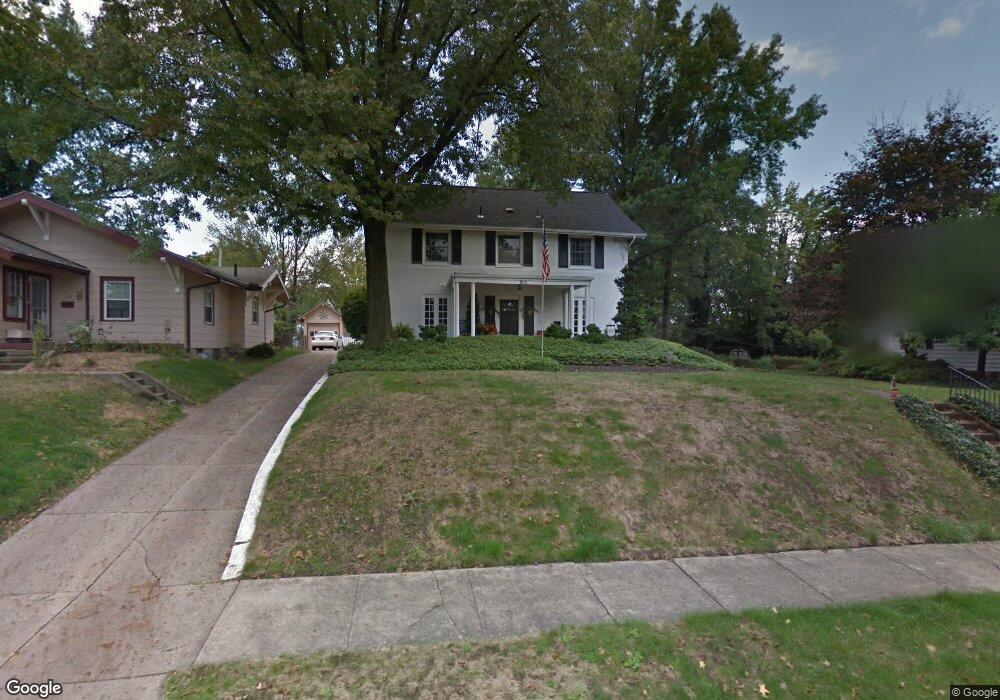
855 Phillips Rd NE Massillon, OH 44646
Sippo Heights NeighborhoodEstimated Value: $160,000 - $197,000
4
Beds
2
Baths
2,024
Sq Ft
$88/Sq Ft
Est. Value
About This Home
This home is located at 855 Phillips Rd NE, Massillon, OH 44646 and is currently estimated at $178,022, approximately $87 per square foot. 855 Phillips Rd NE is a home located in Stark County with nearby schools including Massillon Intermediate School, Massillon Junior High School, and Washington High School.
Ownership History
Date
Name
Owned For
Owner Type
Purchase Details
Closed on
Jan 14, 2016
Sold by
Mcconnell David A and Mcconnell Manthus M
Bought by
Mcconnell Amanthus M and Mcconnell Amanthaus A
Current Estimated Value
Purchase Details
Closed on
Aug 24, 2007
Sold by
Zito David P and Zito Jane S
Bought by
Mcconnell David A and Mcconnell Amanthus A
Home Financials for this Owner
Home Financials are based on the most recent Mortgage that was taken out on this home.
Original Mortgage
$160,550
Interest Rate
6.77%
Mortgage Type
Purchase Money Mortgage
Purchase Details
Closed on
Aug 3, 2006
Sold by
Straughn R Thomas and Straughn Nancy J
Bought by
Zito David P and Zito Jane S
Create a Home Valuation Report for This Property
The Home Valuation Report is an in-depth analysis detailing your home's value as well as a comparison with similar homes in the area
Home Values in the Area
Average Home Value in this Area
Purchase History
| Date | Buyer | Sale Price | Title Company |
|---|---|---|---|
| Mcconnell Amanthus M | $49,300 | Attorney | |
| Mcconnell David A | $169,000 | Acta | |
| Zito David P | -- | None Available |
Source: Public Records
Mortgage History
| Date | Status | Borrower | Loan Amount |
|---|---|---|---|
| Previous Owner | Mcconnell David A | $160,550 |
Source: Public Records
Tax History Compared to Growth
Tax History
| Year | Tax Paid | Tax Assessment Tax Assessment Total Assessment is a certain percentage of the fair market value that is determined by local assessors to be the total taxable value of land and additions on the property. | Land | Improvement |
|---|---|---|---|---|
| 2025 | -- | $54,920 | $10,330 | $44,590 |
| 2024 | -- | $54,920 | $10,330 | $44,590 |
| 2023 | $2,136 | $41,760 | $8,860 | $32,900 |
| 2022 | $2,139 | $41,760 | $8,860 | $32,900 |
| 2021 | $2,173 | $41,760 | $8,860 | $32,900 |
| 2020 | $1,956 | $35,360 | $7,250 | $28,110 |
| 2019 | $1,928 | $35,360 | $7,250 | $28,110 |
| 2018 | $2,408 | $35,360 | $7,250 | $28,110 |
| 2017 | $1,901 | $32,760 | $6,580 | $26,180 |
| 2016 | $2,317 | $32,760 | $6,580 | $26,180 |
| 2015 | $1,817 | $31,190 | $6,580 | $24,610 |
| 2014 | $196 | $30,460 | $6,440 | $24,020 |
| 2013 | $923 | $30,460 | $6,440 | $24,020 |
Source: Public Records
Map
Nearby Homes
- 740 Phillips Rd NE
- 1706 Jefferson Rd NE
- 719 17th St NE
- 712 Harmon Place NE
- 727 Franklin Rd NE
- 932 Wales Rd NE
- 1112 State Ave NE
- 860 Franklin Rd NE
- 1224 North Ave NE
- 860 Milburn Rd NE
- 1720 Lincoln Way E
- 888 Seneca St NE
- 1837 Lindbergh Ave NE
- 834 9th St NE
- 1012 Federal Ave NE
- 827 9th St NE
- 819 Irvington Ave NE
- 739 Vogel Ave NE
- 742 Sheffield Ave NE
- 832 Wellman Ave SE
- 849 Phillips Rd NE
- 865 Phillips Rd NE
- 808 Campbell Cir NE
- 834 Campbell Cir NE
- 822 Campbell Cir NE
- 852 Phillips Rd NE
- 860 Phillips Rd NE
- 850 Phillips Rd NE
- 875 Phillips Rd NE
- 856 Campbell Cir NE
- 864 Phillips Rd NE
- 844 Phillips Rd NE
- 868 Phillips Rd NE
- 879 Phillips Rd NE
- 807 Campbell Cir NE
- 813 Campbell Cir NE
- 872 Phillips Rd NE
- 832 Phillips Rd NE
- 821 Campbell Cir NE
- 825 Campbell Cir NE