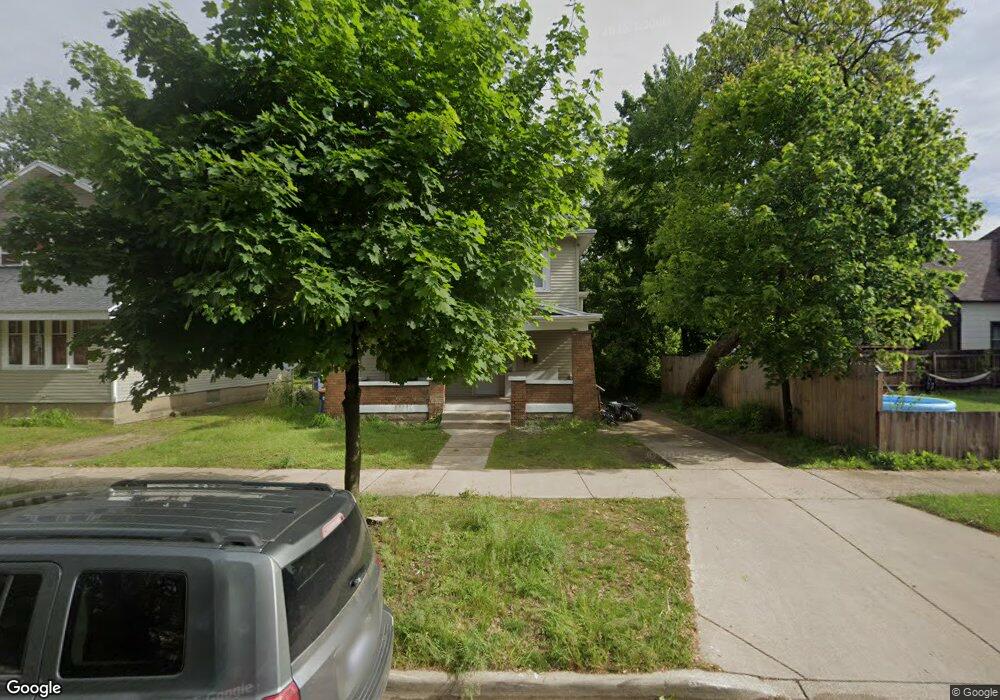
855 Watkins St SE Grand Rapids, MI 49507
South East End NeighborhoodEstimated Value: $191,000 - $243,000
--
Bed
--
Bath
1,560
Sq Ft
$139/Sq Ft
Est. Value
About This Home
This home is located at 855 Watkins St SE, Grand Rapids, MI 49507 and is currently estimated at $216,363, approximately $138 per square foot. 855 Watkins St SE is a home located in Kent County with nearby schools including Campus Elementary School, Alger Middle School, and Ottawa Hills High School.
Ownership History
Date
Name
Owned For
Owner Type
Purchase Details
Closed on
Mar 7, 2025
Sold by
Muziga Pierre and Nyirakaneza Bukumi
Bought by
Mupenzi Emmanuel and Muneza Emmanuel
Current Estimated Value
Purchase Details
Closed on
Aug 3, 2020
Sold by
Ntare Joseph
Bought by
Muziga Pierre and Nyirakaneza Bukumi
Purchase Details
Closed on
Dec 2, 2019
Sold by
Johnson Freddie and Johnson Charles
Bought by
Natare Joseph
Purchase Details
Closed on
May 1, 2015
Sold by
Johnson Freddie and Johnson Charlene
Bought by
Ntare Joseph
Purchase Details
Closed on
Apr 28, 2010
Sold by
Glasper Michelle
Bought by
Johnson Freddie and Johnson Charlene
Purchase Details
Closed on
Sep 1, 2009
Sold by
Johnson Freddie L and Johnson Charlene
Bought by
Johnson Freddie L and Johnson Charlene
Purchase Details
Closed on
Aug 6, 1982
Create a Home Valuation Report for This Property
The Home Valuation Report is an in-depth analysis detailing your home's value as well as a comparison with similar homes in the area
Home Values in the Area
Average Home Value in this Area
Purchase History
| Date | Buyer | Sale Price | Title Company |
|---|---|---|---|
| Mupenzi Emmanuel | -- | None Listed On Document | |
| Muziga Pierre | $50,000 | None Available | |
| Natare Joseph | $55,000 | None Available | |
| Ntare Joseph | $55,000 | None Available | |
| Ntare Joseph | -- | None Available | |
| Johnson Freddie | -- | None Available | |
| Glasper Michelle | -- | None Available | |
| Johnson Freddie L | -- | None Available | |
| -- | $8,000 | -- |
Source: Public Records
Mortgage History
| Date | Status | Borrower | Loan Amount |
|---|---|---|---|
| Closed | Ntare Joseph | $0 |
Source: Public Records
Tax History Compared to Growth
Tax History
| Year | Tax Paid | Tax Assessment Tax Assessment Total Assessment is a certain percentage of the fair market value that is determined by local assessors to be the total taxable value of land and additions on the property. | Land | Improvement |
|---|---|---|---|---|
| 2025 | $2,727 | $88,200 | $0 | $0 |
| 2024 | $2,727 | $80,100 | $0 | $0 |
| 2023 | $2,705 | $65,600 | $0 | $0 |
| 2022 | $2,571 | $58,800 | $0 | $0 |
| 2021 | $1,632 | $48,000 | $0 | $0 |
| 2020 | $1,506 | $44,800 | $0 | $0 |
| 2019 | $1,542 | $38,200 | $0 | $0 |
| 2018 | $1,670 | $32,400 | $0 | $0 |
| 2017 | $1,308 | $27,400 | $0 | $0 |
| 2016 | $1,314 | $24,500 | $0 | $0 |
| 2015 | $1,252 | $24,500 | $0 | $0 |
| 2013 | -- | $26,100 | $0 | $0 |
Source: Public Records
Map
Nearby Homes
- 910 Prince St SE
- 853 Geneva Ave SE
- 940 Eastern Ave SE
- 931 Alexander St SE Unit 933
- 758 Prince St SE
- 747 Prince St SE
- 1007 Watkins St SE
- 937 Humbolt St SE
- 835 Bates St SE
- 1053 Martin Luther King Junior St SE
- 1134 Alexander St SE
- 1122 Martin Luther King Junior St SE
- 1034 Cooper Ave SE
- 1145 Fisk St SE
- 1138 Thomas St SE
- 1114 Hall St SE
- 700 Union Ave SE
- 544 Woodlawn St SE
- 528 Woodlawn St SE
- 1100 Underwood Ave SE
- 851 Watkins St SE
- 919 Kalamazoo Ave SE
- 915 Kalamazoo Ave SE
- 923 Kalamazoo Ave SE
- 847 Watkins St SE
- 854 Prince St SE
- 907 Kalamazoo Ave SE
- 852 Prince St SE
- 850 Prince St SE
- 839 Watkins St SE
- 935 Kalamazoo Ave SE
- 864 Prince St SE
- 864 Prince St SE Unit 866
- 854 Watkins St SE
- 842 Prince St SE
- 850 Watkins St SE
- 835 Watkins St SE
- 939 Kalamazoo Ave SE
- 844 Watkins St SE
- 836 Prince St SE