Estimated Value: $545,000 - $661,000
5
Beds
3
Baths
2,770
Sq Ft
$209/Sq Ft
Est. Value
About This Home
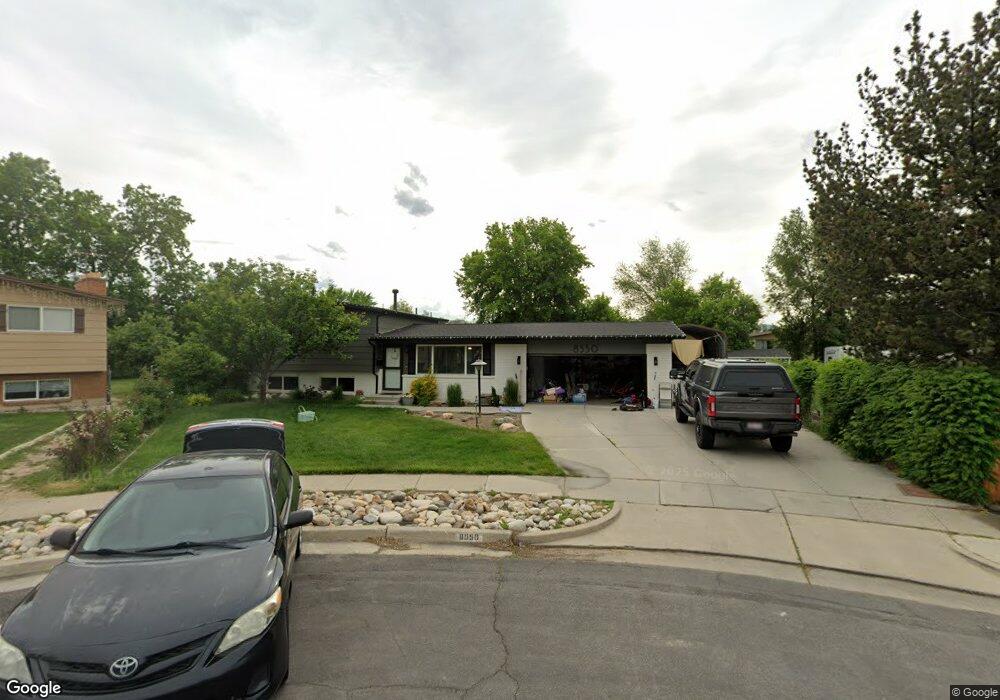
This home is located at 8550 S Clairmont Cir, Sandy, UT 84070 and is currently estimated at $578,280, approximately $208 per square foot. 8550 S Clairmont Cir is a home located in Salt Lake County with nearby schools including Sandy Elementary School, Mount Jordan Middle School, and Jordan High.
Ownership History
Date
Name
Owned For
Owner Type
Purchase Details
Closed on
Mar 20, 2012
Sold by
Federal Home Loan Mortgage Corporation
Bought by
Williams Clay R and Williams Nicole M
Current Estimated Value
Home Financials for this Owner
Home Financials are based on the most recent Mortgage that was taken out on this home.
Original Mortgage
$185,250
Outstanding Balance
$127,071
Interest Rate
3.84%
Mortgage Type
New Conventional
Estimated Equity
$451,209
Purchase Details
Closed on
Nov 16, 2011
Sold by
Wisner Kathy L
Bought by
Federal Home Loan Mortgage Corporation
Purchase Details
Closed on
Aug 28, 2005
Sold by
Bird Roger
Bought by
Wisner Kathy L
Home Financials for this Owner
Home Financials are based on the most recent Mortgage that was taken out on this home.
Original Mortgage
$208,905
Interest Rate
5.64%
Mortgage Type
Fannie Mae Freddie Mac
Purchase Details
Closed on
Dec 6, 2002
Sold by
Smalley Joanne A
Bought by
Bird Roger
Home Financials for this Owner
Home Financials are based on the most recent Mortgage that was taken out on this home.
Original Mortgage
$121,600
Interest Rate
6.28%
Purchase Details
Closed on
Aug 17, 1995
Sold by
Smalley Peter W
Bought by
Smalley Joanne A
Create a Home Valuation Report for This Property
The Home Valuation Report is an in-depth analysis detailing your home's value as well as a comparison with similar homes in the area
Home Values in the Area
Average Home Value in this Area
Purchase History
| Date | Buyer | Sale Price | Title Company |
|---|---|---|---|
| Williams Clay R | -- | Bonneville Superior Title | |
| Federal Home Loan Mortgage Corporation | $177,900 | None Available | |
| Wisner Kathy L | -- | Landmark Title | |
| Bird Roger | -- | Cottonwood Title Ins Agency | |
| Smalley Joanne A | -- | -- |
Source: Public Records
Mortgage History
| Date | Status | Borrower | Loan Amount |
|---|---|---|---|
| Open | Williams Clay R | $185,250 | |
| Previous Owner | Wisner Kathy L | $208,905 | |
| Previous Owner | Bird Roger | $121,600 |
Source: Public Records
Tax History Compared to Growth
Tax History
| Year | Tax Paid | Tax Assessment Tax Assessment Total Assessment is a certain percentage of the fair market value that is determined by local assessors to be the total taxable value of land and additions on the property. | Land | Improvement |
|---|---|---|---|---|
| 2025 | $2,784 | $523,600 | $131,300 | $392,300 |
| 2024 | $2,784 | $514,900 | $123,400 | $391,500 |
| 2023 | $2,784 | $483,200 | $117,300 | $365,900 |
| 2022 | $2,765 | $498,100 | $115,000 | $383,100 |
| 2021 | $2,464 | $377,800 | $100,000 | $277,800 |
| 2020 | $2,361 | $341,400 | $81,000 | $260,400 |
| 2019 | $2,246 | $316,500 | $81,000 | $235,500 |
| 2018 | $1,882 | $276,100 | $81,000 | $195,100 |
| 2017 | $1,827 | $256,100 | $72,000 | $184,100 |
| 2016 | $1,841 | $249,400 | $72,000 | $177,400 |
| 2015 | $1,796 | $225,200 | $74,900 | $150,300 |
| 2014 | $1,753 | $215,500 | $72,700 | $142,800 |
Source: Public Records
Map
Nearby Homes
- 8550 S 570 E
- 547 E Pioneer Ave
- 627 E 8680 S
- 386 Pioneer Ave
- 8732 S 620 E
- 354 E 8620 S
- 343 E 8680 S
- 8322 S Levine Ln Unit 111
- 8544 S 300 E
- 283 E Pioneer Ave
- 608 E 8800 S
- 8729 S Leafwood Ln
- 416 E 8260 S
- 651 E Williamsburg Park Cir
- 657 E Williamsburg Park Cir
- 8722 S Oakwood Park Cir Unit 8722
- 8284 S 745 E
- 775 E Autumn Field Dr
- 772 E 8270 S
- 8915 S 660 E Unit 103
- 8550 Clairmont Cir
- 8560 Clairmont Cir
- 8560 S Clairmont Cir Unit A
- 8560 S Clairmont Cir
- 554 E Pioneer Ave
- 554 Pioneer Ave
- 8555 S 520 E
- 8569 S 520 E
- 536 Pioneer Ave
- 536 E Pioneer Ave
- 559 E 8600 S
- 8559 Clairmont Cir
- 8583 S 520 E
- 8602 S 550 E
- 8549 Clairmont Cir
- 586 Pioneer Ave
- 569 E 8600 S
- 547 Pioneer Ave
- 535 Pioneer Ave
- 8562 S 520 E