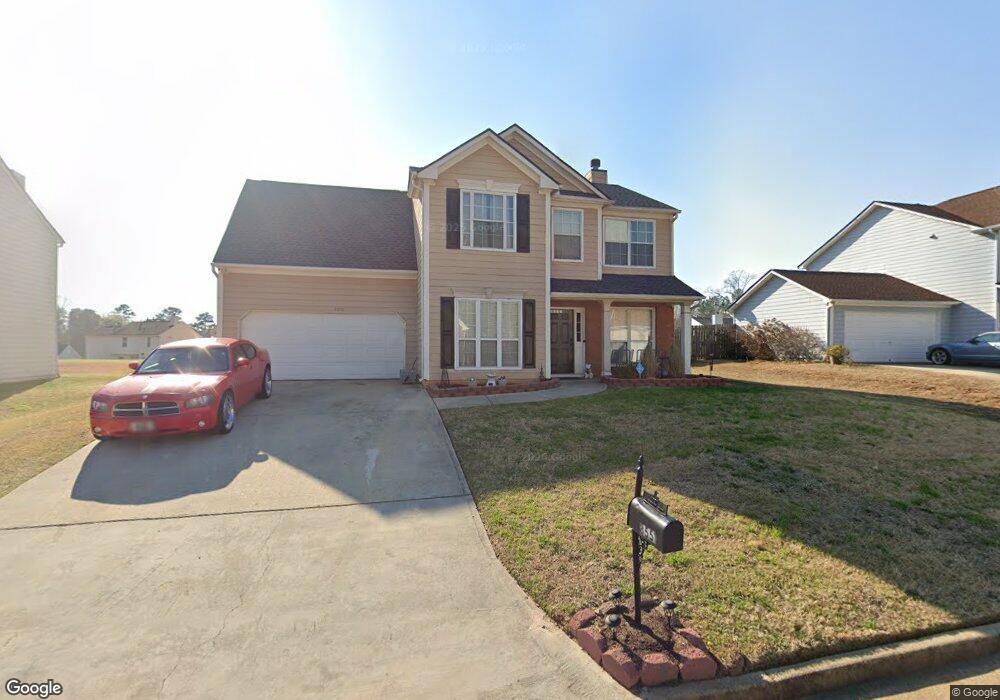
8551 Lakemeadow Dr Union City, GA 30291
Estimated Value: $263,949 - $299,000
4
Beds
3
Baths
1,866
Sq Ft
$148/Sq Ft
Est. Value
About This Home
This home is located at 8551 Lakemeadow Dr, Union City, GA 30291 and is currently estimated at $276,487, approximately $148 per square foot. 8551 Lakemeadow Dr is a home located in Fulton County with nearby schools including Liberty Point Elementary School, Camp Creek Middle School, and Langston Hughes High School.
Ownership History
Date
Name
Owned For
Owner Type
Purchase Details
Closed on
Apr 20, 2012
Sold by
Tink Wise Llc
Bought by
Jones Gregory and Jones Lois H
Current Estimated Value
Home Financials for this Owner
Home Financials are based on the most recent Mortgage that was taken out on this home.
Original Mortgage
$92,493
Outstanding Balance
$64,901
Interest Rate
4.25%
Mortgage Type
FHA
Estimated Equity
$211,586
Purchase Details
Closed on
Oct 28, 2011
Sold by
Secretary Of Housing And U
Bought by
Tink Wise
Purchase Details
Closed on
Aug 3, 2010
Sold by
Wells Fargo Bk Na
Bought by
Hud & Housing Of Urban Dev
Purchase Details
Closed on
Feb 23, 2001
Sold by
Inc R Horton Inc D and Inc Torrey
Bought by
Nelson Jerome
Home Financials for this Owner
Home Financials are based on the most recent Mortgage that was taken out on this home.
Original Mortgage
$134,735
Interest Rate
7.02%
Mortgage Type
New Conventional
Create a Home Valuation Report for This Property
The Home Valuation Report is an in-depth analysis detailing your home's value as well as a comparison with similar homes in the area
Home Values in the Area
Average Home Value in this Area
Purchase History
| Date | Buyer | Sale Price | Title Company |
|---|---|---|---|
| Jones Gregory | $94,900 | -- | |
| Tink Wise | $50,000 | -- | |
| Hud & Housing Of Urban Dev | -- | -- | |
| Wells Fargo Bk Na | $126,749 | -- | |
| Nelson Jerome | $135,800 | -- |
Source: Public Records
Mortgage History
| Date | Status | Borrower | Loan Amount |
|---|---|---|---|
| Open | Jones Gregory | $92,493 | |
| Previous Owner | Nelson Jerome | $134,735 |
Source: Public Records
Tax History Compared to Growth
Tax History
| Year | Tax Paid | Tax Assessment Tax Assessment Total Assessment is a certain percentage of the fair market value that is determined by local assessors to be the total taxable value of land and additions on the property. | Land | Improvement |
|---|---|---|---|---|
| 2025 | $1,258 | $98,800 | $22,480 | $76,320 |
| 2023 | $2,478 | $87,800 | $14,760 | $73,040 |
| 2022 | $2,310 | $87,800 | $14,760 | $73,040 |
| 2021 | $1,963 | $72,360 | $11,400 | $60,960 |
| 2020 | $1,672 | $60,160 | $9,160 | $51,000 |
| 2019 | $2,496 | $59,080 | $9,000 | $50,080 |
| 2018 | $1,478 | $52,360 | $8,280 | $44,080 |
| 2017 | $1,356 | $46,480 | $10,720 | $35,760 |
| 2016 | $1,356 | $46,480 | $10,720 | $35,760 |
| 2015 | $2,091 | $46,480 | $10,720 | $35,760 |
| 2014 | $977 | $31,880 | $7,160 | $24,720 |
Source: Public Records
Map
Nearby Homes
- 000 Highpoint Rd
- 99 Highpoint Rd
- 0 Highpoint Rd Unit 10553938
- 6320 Littleton Dr
- 3227 Diamond Bluff
- 3426 Newgold Trace
- 9515 Lakeview Rd
- 6000 Diamond Ln
- 6024 Diamond Ln
- 4105 Ravenwood Ct Unit 3
- 5947 Rock Rd
- 4121 Ravenwood Ct
- 9899 Vista Cir
- 4611 Ravenwood Loop
- 4615 Ravenwood Loop
- 9886 Vista Cir
- 5856 Rock Rd
- 5910 Rock Rd
- 0 Lakeside Dr Unit 22475152
- 0 Lakeside Dr Unit 7515650
- 8549 Lakemeadow Dr
- 8553 Lakemeadow Dr
- 8658 Valley Lakes Ln Unit I
- 8547 Lakemeadow Dr Unit 1
- 8555 Lakemeadow Dr Unit 1
- 8660 Valley Lakes Ln
- 8656 Valley Lakes Ln
- 8662 Valley Lakes Ln
- 8552 Lakemeadow Dr Unit 1
- 8550 Lakemeadow Dr
- 8654 Valley Lakes Ln Unit I
- 8557 Lakemeadow Dr
- 8554 Lakemeadow Dr Unit 1
- 8664 Valley Lakes Ln
- 8548 Lakemeadow Dr
- 8556 Lakemeadow Dr
- 8545 Lakemeadow Dr
- 8559 Lakemeadow Dr Unit I
- 8558 Lakemeadow Dr
- 8123 Valley Ridge Dr Unit I