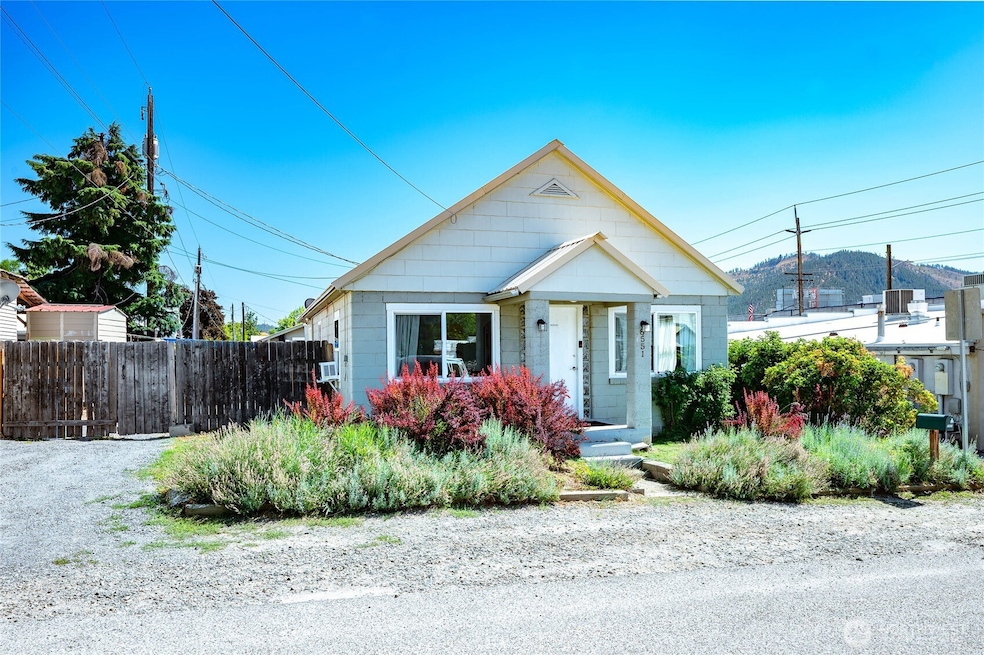


8551 Orchard St Peshastin, WA 98847
Estimated payment $1,954/month
Highlights
- RV Access or Parking
- No HOA
- Bathroom on Main Level
- Territorial View
- Storm Windows
- 1-Story Property
About This Home
A great little home in the heart of downtown Peshastin. This single-level home is easy to maintain and has a smart layout that makes the most of the space. Enjoy walking trails along the river, the nearby library, pub and convenience store and a bus stop just around the corner. Fenced backyard and off-street parking big enough for an RV. Affordable living in a great location! Priced to move quickly! Reviewing offers Sept 2nd.
Source: Northwest Multiple Listing Service (NWMLS)
MLS#: 2425079
Home Details
Home Type
- Single Family
Est. Annual Taxes
- $1,262
Year Built
- Built in 1949
Lot Details
- 2,178 Sq Ft Lot
- Lot Dimensions are 39x39x8x35x47x75
- Northwest Facing Home
- Partially Fenced Property
- Level Lot
- Garden
Home Design
- Poured Concrete
- Metal Roof
- Wood Siding
- Wood Composite
Interior Spaces
- 912 Sq Ft Home
- 1-Story Property
- Territorial Views
- Storm Windows
Kitchen
- Stove
- Dishwasher
Flooring
- Carpet
- Vinyl Plank
- Vinyl
Bedrooms and Bathrooms
- 2 Main Level Bedrooms
- Bathroom on Main Level
- 1 Full Bathroom
Laundry
- Dryer
- Washer
Parking
- Driveway
- Off-Street Parking
- RV Access or Parking
Outdoor Features
- Outbuilding
Schools
- Peshastin Dryden Ele Elementary School
- Icicle River Mid Middle School
- Cascade High School
Utilities
- Window Unit Cooling System
- Heating System Mounted To A Wall or Window
Community Details
- No Home Owners Association
- Peshastin Subdivision
Listing and Financial Details
- Down Payment Assistance Available
- Visit Down Payment Resource Website
- Assessor Parcel Number 241817768140
Map
Home Values in the Area
Average Home Value in this Area
Tax History
| Year | Tax Paid | Tax Assessment Tax Assessment Total Assessment is a certain percentage of the fair market value that is determined by local assessors to be the total taxable value of land and additions on the property. | Land | Improvement |
|---|---|---|---|---|
| 2021 | $943 | $102,758 | $22,000 | $80,758 |
| 2020 | $1,119 | $117,147 | $20,000 | $97,147 |
| 2019 | $1,013 | $110,582 | $20,000 | $90,582 |
| 2018 | $1,011 | $97,615 | $21,060 | $76,555 |
| 2017 | $958 | $90,217 | $20,160 | $70,057 |
| 2016 | $474 | $90,740 | $19,936 | $70,804 |
| 2015 | $474 | $81,443 | $17,000 | $64,443 |
| 2013 | $474 | $62,000 | $20,000 | $42,000 |
Property History
| Date | Event | Price | Change | Sq Ft Price |
|---|---|---|---|---|
| 09/03/2025 09/03/25 | Pending | -- | -- | -- |
| 08/25/2025 08/25/25 | For Sale | $350,000 | -- | $384 / Sq Ft |
Purchase History
| Date | Type | Sale Price | Title Company |
|---|---|---|---|
| Warranty Deed | $188,000 | First American Title | |
| Warranty Deed | $90,000 | North American Title | |
| Warranty Deed | -- | North Meridian Title | |
| Land Contract | $30,000 | None Available | |
| Contract Of Sale | $50,000 | None Available |
Mortgage History
| Date | Status | Loan Amount | Loan Type |
|---|---|---|---|
| Closed | $0 | Seller Take Back |
Source: Northwest Multiple Listing Service (NWMLS)
MLS Number: 2425079
APN: 241817768140
Disclaimer: Certain information contained herein is derived from information provided by parties other than Homes.com. All information provided is deemed reliable, but is not guaranteed to be accurate and should be independently verified.
![]() All data is obtained from various sources and may not have been verified by broker or MLS GRID. Supplied Open House Information is subject to change without notice. All information should be independently reviewed and verified for accuracy. Properties may or may not be listed by the office/agent presenting the information. Listing information is provided by the Northwest Multiple Listing Service (NWMLS). Property information is based on available data that may include MLS information, county records, and other sources. Listings marked with the 3 tree icon and provided by NWMLS. All properties are subject to prior sale or withdrawal. IDX information is provided exclusively for consumers’ personal noncommercial use, that it may not be used for any purpose other than to identify prospective properties consumers may be interested in purchasing, that the data is deemed reliable but is not guaranteed by MLS GRID. ©2025 NWMLS.
All data is obtained from various sources and may not have been verified by broker or MLS GRID. Supplied Open House Information is subject to change without notice. All information should be independently reviewed and verified for accuracy. Properties may or may not be listed by the office/agent presenting the information. Listing information is provided by the Northwest Multiple Listing Service (NWMLS). Property information is based on available data that may include MLS information, county records, and other sources. Listings marked with the 3 tree icon and provided by NWMLS. All properties are subject to prior sale or withdrawal. IDX information is provided exclusively for consumers’ personal noncommercial use, that it may not be used for any purpose other than to identify prospective properties consumers may be interested in purchasing, that the data is deemed reliable but is not guaranteed by MLS GRID. ©2025 NWMLS.
Based on information submitted to the MLS GRID
- 8612 Ludwig Hill Rd
- 0 Larson Rd Unit NWM2357970
- 8348 Main St Unit 6
- 80 Still Ln
- 102 Still Ln
- 122 Still Ln
- 162 Still Ln
- 8010 Green Rd
- 10801 Us Hwy 2
- 9291 Pakascwa Rd
- 9615 North Rd
- 9377 Lone Pine Orchards Rd
- 7569 Us Hwy 97
- 9753 Nibbelink Rd
- 10755 North Rd
- 0 Rollercoaster Rd
- 981 Nighthawk Ridge Ln
- 510 Dempsey Rd
- 11709 Pear Tree Ct
- 8830 School St
