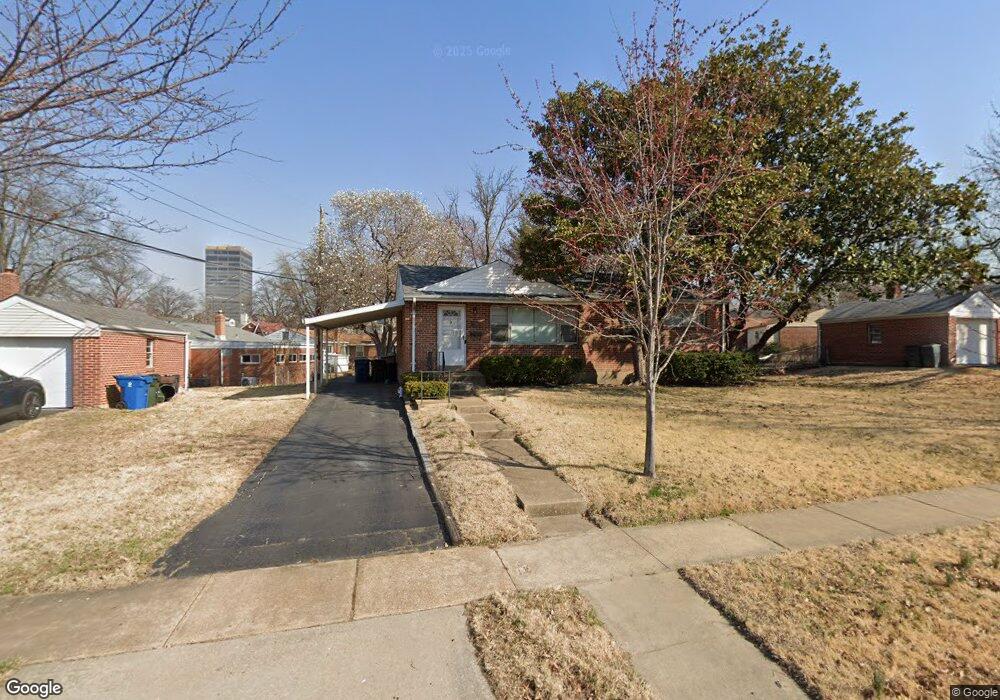
8555 Bryan Ave Saint Louis, MO 63117
Estimated Value: $257,547 - $357,000
3
Beds
1
Bath
1,040
Sq Ft
$295/Sq Ft
Est. Value
About This Home
This home is located at 8555 Bryan Ave, Saint Louis, MO 63117 and is currently estimated at $306,887, approximately $295 per square foot. 8555 Bryan Ave is a home located in St. Louis County with nearby schools including Meramec Elementary, Wydown Middle School, and Clayton High School.
Ownership History
Date
Name
Owned For
Owner Type
Purchase Details
Closed on
Jul 19, 2017
Sold by
1993 Investment Co Lp
Bought by
Jaffe Mark E and Mark E Jaffe Revocable Trust
Current Estimated Value
Purchase Details
Closed on
May 22, 2017
Sold by
Silvermintz Marshall Alan and Silvermintz Howard Lee
Bought by
1993 Investment Company Lp
Purchase Details
Closed on
Aug 22, 2015
Sold by
Silvermintz Marshall Alan and Silvermintz Howard Lee
Bought by
Silvermintz Marshall Alan and Silvermintz Howard Lee
Purchase Details
Closed on
May 16, 2006
Sold by
Silvermintz Marshall Alan and Silvermintz Howard Lee
Bought by
Silvermintz Marshall Alan and Silvermintz Howard Lee
Purchase Details
Closed on
Jan 27, 1998
Sold by
Silvermintz Wilbur H and Silvermintz Loretta G
Bought by
Silvermintz Wilbur H and Silvermintz Loretta G
Create a Home Valuation Report for This Property
The Home Valuation Report is an in-depth analysis detailing your home's value as well as a comparison with similar homes in the area
Home Values in the Area
Average Home Value in this Area
Purchase History
| Date | Buyer | Sale Price | Title Company |
|---|---|---|---|
| Jaffe Mark E | -- | Security Title Ins Agency Cm | |
| 1993 Investment Company Lp | -- | Security Title Ins Agency Cm | |
| Silvermintz Marshall Alan | -- | None Available | |
| Silvermintz Marshall Alan | -- | None Available | |
| Silvermintz Wilbur H | -- | -- |
Source: Public Records
Tax History
| Year | Tax Paid | Tax Assessment Tax Assessment Total Assessment is a certain percentage of the fair market value that is determined by local assessors to be the total taxable value of land and additions on the property. | Land | Improvement |
|---|---|---|---|---|
| 2025 | $2,861 | $48,790 | $35,130 | $13,660 |
| 2024 | $2,861 | $42,870 | $21,870 | $21,000 |
| 2023 | $2,860 | $42,870 | $21,870 | $21,000 |
| 2022 | $2,642 | $37,370 | $21,870 | $15,500 |
| 2021 | $2,625 | $37,370 | $21,870 | $15,500 |
| 2020 | $2,687 | $37,050 | $21,870 | $15,180 |
| 2019 | $2,663 | $37,050 | $21,870 | $15,180 |
| 2018 | $2,388 | $34,250 | $17,400 | $16,850 |
| 2016 | $2,168 | $29,870 | $13,570 | $16,300 |
Source: Public Records
Map
Nearby Homes
- 8508 Bryan Ave
- 28 Lake Forest Dr
- 1459 Bobolink Place
- 1465 Bobolink Place Unit 1465
- 1436 Bluebird Terrace Unit 1436
- 1438 Bluebird Terrace Unit 1438
- 8919 E Gateway Heights Unit 94-804
- 8916 Gateway Cir Unit 41-805
- 8923 E Gateway Heights Unit 94-805
- 8927 E Gateway Heights Unit 94-806
- 8931 E Gateway Heights Unit 94-807
- 1432 Thrush Place Unit 1432
- 1624 E Swan Cir Unit 1624
- 8928 W Gateway Cir Unit 41-802
- 1347 W Gateway Heights Unit 53-603
- 8912 N Swan Cir
- 8021 Bennett Ave
- 1540 High School Dr Unit 1540
- 8979 Eager Rd
- 8019 Crescent Dr
- 1212 E Linden Ave
- 8549 Bryan Ave
- 1208 E Linden Ave
- 1231 Kurt Ave
- 1204 E Linden Ave
- 8556 Bryan Ave
- 8552 Bryan Ave
- 1200 E Linden Ave
- 1229 Kurt Ave
- 8548 Bryan Ave
- 1216 E Linden Ave
- 8544 Bryan Ave
- 1209 E Linden Ave
- 1128 E Linden Ave
- 1225 Kurt Ave
- 8543 Bryan Ave
- 8540 Bryan Ave
- 1162 E Linden Ave
- 1124 E Linden Ave
- 8500 Antler Dr
Your Personal Tour Guide
Ask me questions while you tour the home.