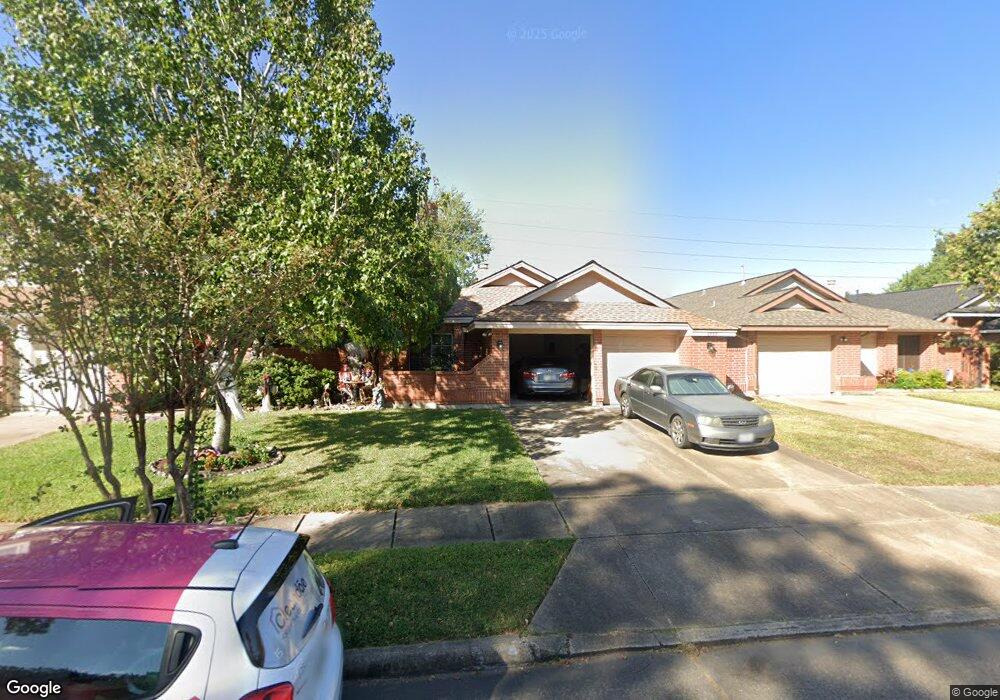
8555 Pool Creek Dr Houston, TX 77095
Copperfield NeighborhoodEstimated Value: $232,000 - $276,000
3
Beds
2
Baths
1,624
Sq Ft
$157/Sq Ft
Est. Value
About This Home
This home is located at 8555 Pool Creek Dr, Houston, TX 77095 and is currently estimated at $254,310, approximately $156 per square foot. 8555 Pool Creek Dr is a home located in Harris County with nearby schools including Fiest Elementary School, Labay Middle School, and Cypress Falls High School.
Ownership History
Date
Name
Owned For
Owner Type
Purchase Details
Closed on
Mar 17, 2016
Sold by
Goncena Dan and Goncena Melinda Ann
Bought by
Davidsion Mark Edward
Current Estimated Value
Home Financials for this Owner
Home Financials are based on the most recent Mortgage that was taken out on this home.
Original Mortgage
$135,280
Outstanding Balance
$106,780
Interest Rate
3.65%
Mortgage Type
New Conventional
Estimated Equity
$147,530
Purchase Details
Closed on
Jun 27, 2008
Sold by
Rodriguez Martin and Krall Barbara A
Bought by
Goncena Dan
Home Financials for this Owner
Home Financials are based on the most recent Mortgage that was taken out on this home.
Original Mortgage
$101,365
Interest Rate
6.05%
Mortgage Type
Purchase Money Mortgage
Create a Home Valuation Report for This Property
The Home Valuation Report is an in-depth analysis detailing your home's value as well as a comparison with similar homes in the area
Home Values in the Area
Average Home Value in this Area
Purchase History
| Date | Buyer | Sale Price | Title Company |
|---|---|---|---|
| Davidsion Mark Edward | $135,280 | None Available | |
| Goncena Dan | -- | Startex 05 Title Company |
Source: Public Records
Mortgage History
| Date | Status | Borrower | Loan Amount |
|---|---|---|---|
| Open | Davidsion Mark Edward | $135,280 | |
| Previous Owner | Goncena Dan | $101,365 |
Source: Public Records
Tax History Compared to Growth
Tax History
| Year | Tax Paid | Tax Assessment Tax Assessment Total Assessment is a certain percentage of the fair market value that is determined by local assessors to be the total taxable value of land and additions on the property. | Land | Improvement |
|---|---|---|---|---|
| 2025 | $3,224 | $275,655 | $56,100 | $219,555 |
| 2024 | $3,224 | $281,459 | $46,860 | $234,599 |
| 2023 | $3,224 | $278,125 | $46,860 | $231,265 |
| 2022 | $4,650 | $249,943 | $33,440 | $216,503 |
| 2021 | $4,454 | $203,214 | $33,440 | $169,774 |
| 2020 | $4,159 | $192,833 | $27,940 | $164,893 |
| 2019 | $3,913 | $181,694 | $27,940 | $153,754 |
| 2018 | $2,075 | $144,129 | $27,940 | $116,189 |
| 2017 | $3,306 | $144,129 | $27,940 | $116,189 |
| 2016 | $2,751 | $119,917 | $27,940 | $91,977 |
| 2015 | $1,809 | $119,917 | $27,940 | $91,977 |
| 2014 | $1,809 | $102,302 | $21,560 | $80,742 |
Source: Public Records
Map
Nearby Homes
- 8550 Waiting Spring Ln
- 8426 Laurel Trails Dr
- 8550 Sparkling Springs Dr
- 15954 Oak Mountain Dr
- 8306 Lake Crystal Dr
- 16123 Aberdeen Forest Dr
- 16111 Aberdeen Forest Dr
- 16403 Torry View Terrace
- 8526 Hot Springs Dr
- 16335 Drystone Ln
- 16211 Green Smoke Dr
- 16426 Torry View Terrace
- 8619 Arranmore Ln
- 8814 Sherina Park Dr
- 8806 Gas Light Village Dr
- 8818 Apple Mill Dr
- 8835 Aberdeen Park Dr
- 16410 Dawnblush Ct
- 15918 Pinyon Creek Dr
- 16511 Crystal View Ct
- 8559 Pool Creek Dr
- 8551 Pool Creek Dr
- 8563 Pool Creek Dr
- 8547 Pool Creek Dr
- 8567 Pool Creek Dr
- 8543 Pool Creek Dr
- 8571 Pool Creek Dr
- 8558 Pool Creek Dr
- 8539 Pool Creek Dr
- 8554 Pool Creek Dr
- 8562 Pool Creek Dr
- 8550 Pool Creek Dr
- 8566 Pool Creek Dr
- 8522 Pool Creek Dr
- 8575 Pool Creek Dr
- 8535 Pool Creek Dr
- 8570 Pool Creek Dr
- 8574 Pool Creek Dr
- 8579 Pool Creek Dr
- 8518 Pool Creek Dr