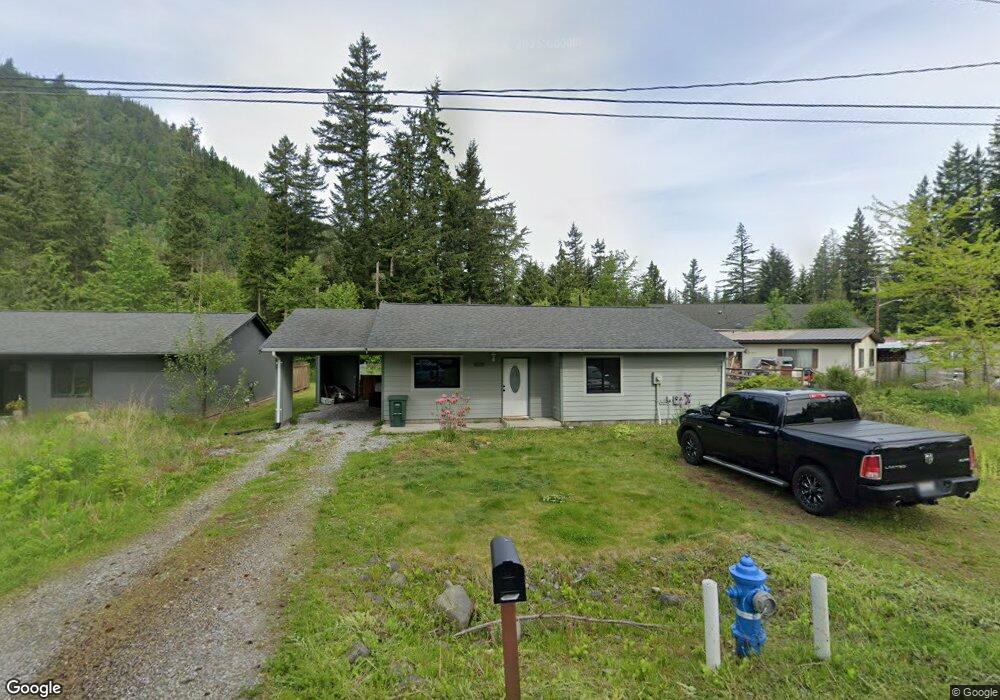
8559 Juniper Place Maple Falls, WA 98266
Estimated Value: $321,000 - $349,000
2
Beds
2
Baths
1,098
Sq Ft
$306/Sq Ft
Est. Value
About This Home
This home is located at 8559 Juniper Place, Maple Falls, WA 98266 and is currently estimated at $335,483, approximately $305 per square foot. 8559 Juniper Place is a home located in Whatcom County with nearby schools including Mount Baker Senior High School.
Ownership History
Date
Name
Owned For
Owner Type
Purchase Details
Closed on
Apr 9, 2024
Sold by
Folden Cody and Folden Kaylee
Bought by
Folden Cody and Folden Kay Lee
Current Estimated Value
Home Financials for this Owner
Home Financials are based on the most recent Mortgage that was taken out on this home.
Original Mortgage
$264,550
Outstanding Balance
$259,859
Interest Rate
6.88%
Mortgage Type
FHA
Estimated Equity
$75,624
Purchase Details
Closed on
Oct 27, 2020
Sold by
Barry Darin
Bought by
Folden Cody
Home Financials for this Owner
Home Financials are based on the most recent Mortgage that was taken out on this home.
Original Mortgage
$10,000
Interest Rate
2.72%
Mortgage Type
New Conventional
Purchase Details
Closed on
Mar 8, 2003
Sold by
Brand C A John and Brand Anna Maria
Bought by
Barry Darin and Barry Mary
Home Financials for this Owner
Home Financials are based on the most recent Mortgage that was taken out on this home.
Original Mortgage
$9,000
Interest Rate
5.83%
Mortgage Type
Seller Take Back
Create a Home Valuation Report for This Property
The Home Valuation Report is an in-depth analysis detailing your home's value as well as a comparison with similar homes in the area
Home Values in the Area
Average Home Value in this Area
Purchase History
| Date | Buyer | Sale Price | Title Company |
|---|---|---|---|
| Folden Cody | $313 | Chicago Title | |
| Folden Cody | $215,000 | Whatcom Land Title | |
| Barry Darin | -- | First American Title Insuran | |
| Brand C A John | -- | First American Title Insuran |
Source: Public Records
Mortgage History
| Date | Status | Borrower | Loan Amount |
|---|---|---|---|
| Open | Folden Cody | $264,550 | |
| Previous Owner | Folden Cody | $10,000 | |
| Previous Owner | Folden Cody | $211,105 | |
| Previous Owner | Barry Darin | $9,000 |
Source: Public Records
Tax History
| Year | Tax Paid | Tax Assessment Tax Assessment Total Assessment is a certain percentage of the fair market value that is determined by local assessors to be the total taxable value of land and additions on the property. | Land | Improvement |
|---|---|---|---|---|
| 2025 | $2,151 | $280,316 | $91,800 | $188,516 |
| 2024 | $2,017 | $273,918 | $90,000 | $183,918 |
| 2023 | $2,017 | $273,755 | $59,634 | $214,121 |
| 2022 | $1,607 | $219,006 | $47,707 | $171,299 |
| 2021 | $1,413 | $173,818 | $37,864 | $135,954 |
| 2020 | $1,473 | $136,865 | $29,814 | $107,051 |
| 2019 | $1,179 | $136,865 | $29,814 | $107,051 |
| 2018 | $1,231 | $119,356 | $26,000 | $93,356 |
| 2017 | $1,041 | $97,778 | $18,784 | $78,994 |
| 2016 | $1,006 | $88,231 | $16,960 | $71,271 |
| 2015 | $942 | $84,647 | $16,560 | $68,087 |
| 2014 | -- | $79,610 | $15,520 | $64,090 |
| 2013 | -- | $83,748 | $16,000 | $67,748 |
Source: Public Records
Map
Nearby Homes
- 8532 Juniper Place
- 1017 Maple Ln
- 1015 Maple Ln
- 6245 Laurel Place
- 1107 Birch Ln
- 6264 Spruce Ct
- 1189 Exit Rd
- 1075 Birch Ln
- 1074 Birch Ln
- 6232 Azure Way
- 2004 Tower Rd
- 6236 Azure Way
- 8672 Bell Ct
- 8471 Golden Valley Dr
- 1056 Birch Ln
- 8470 Golden Valley Dr
- 8388 Holly Ln
- 1131 Alder Ln
- 1111 Alder Ln
- 8350 Holly Ln
- 8563 Juniper Place
- 8555 Juniper Place
- 8569 Golden Valley Dr
- 6140 Beech Place
- 8551 Juniper Place
- 8558 Juniper Place
- 8563 Golden Valley Dr
- 8543 Juniper Place
- 8564 Golden Valley Dr
- 8548 Juniper Place
- 8533 Juniper Place
- 8559 Golden Valley Dr
- 8562 Golden Valley Dr
- 8544 Juniper Place
- 6144 Beech Place
- 8575 Golden Valley Dr
- 8557 Golden Valley Dr
- 8560 Golden Valley Dr
- 6149 Beech Place
- 8574 Golden Valley Dr
Your Personal Tour Guide
Ask me questions while you tour the home.