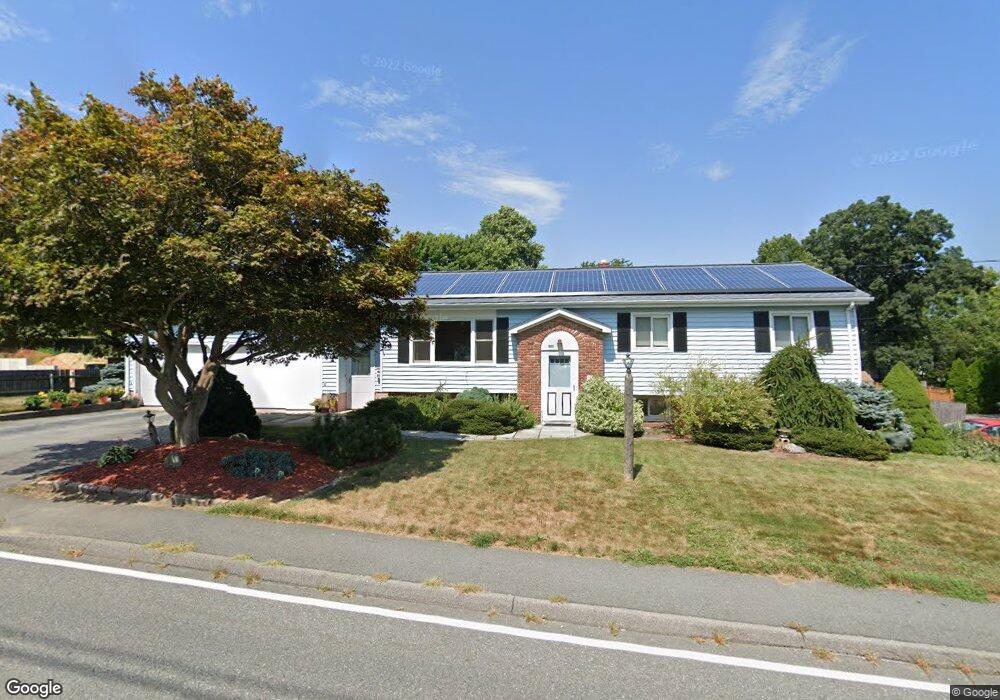
856 Chace St Somerset, MA 02726
Pottersville NeighborhoodEstimated Value: $480,499 - $584,000
3
Beds
2
Baths
1,132
Sq Ft
$460/Sq Ft
Est. Value
About This Home
This home is located at 856 Chace St, Somerset, MA 02726 and is currently estimated at $521,125, approximately $460 per square foot. 856 Chace St is a home located in Bristol County with nearby schools including Chace Street School, Somerset Middle School, and St. Michael's School.
Ownership History
Date
Name
Owned For
Owner Type
Purchase Details
Closed on
Dec 30, 2024
Sold by
St Laurent Mark P and St Laurent Elizabeth A
Bought by
St Laurent Irt and St Laurent
Current Estimated Value
Purchase Details
Closed on
Aug 23, 1988
Sold by
Campos Agnes
Bought by
Campos Charles
Create a Home Valuation Report for This Property
The Home Valuation Report is an in-depth analysis detailing your home's value as well as a comparison with similar homes in the area
Home Values in the Area
Average Home Value in this Area
Purchase History
| Date | Buyer | Sale Price | Title Company |
|---|---|---|---|
| St Laurent Irt | -- | None Available | |
| St Laurent Irt | -- | None Available | |
| Campos Charles | $51,000 | -- |
Source: Public Records
Mortgage History
| Date | Status | Borrower | Loan Amount |
|---|---|---|---|
| Previous Owner | Campos Charles | $130,000 | |
| Previous Owner | Campos Charles | $10,000 | |
| Previous Owner | Campos Charles | $130,000 |
Source: Public Records
Tax History
| Year | Tax Paid | Tax Assessment Tax Assessment Total Assessment is a certain percentage of the fair market value that is determined by local assessors to be the total taxable value of land and additions on the property. | Land | Improvement |
|---|---|---|---|---|
| 2025 | $6,098 | $458,500 | $180,600 | $277,900 |
| 2024 | $5,725 | $447,600 | $180,600 | $267,000 |
| 2023 | $5,061 | $399,100 | $156,800 | $242,300 |
| 2022 | $4,677 | $351,900 | $135,400 | $216,500 |
| 2021 | $4,718 | $321,400 | $122,400 | $199,000 |
| 2020 | $4,647 | $305,300 | $122,400 | $182,900 |
| 2019 | $5,243 | $287,300 | $122,400 | $164,900 |
| 2018 | $4,477 | $264,000 | $118,400 | $145,600 |
| 2017 | $4,374 | $251,400 | $113,000 | $138,400 |
| 2016 | $4,402 | $251,400 | $113,000 | $138,400 |
| 2015 | $4,122 | $237,600 | $107,900 | $129,700 |
| 2014 | $5,864 | $242,800 | $104,800 | $138,000 |
Source: Public Records
Map
Nearby Homes
- 745 Bark St
- 145 Mount Hope Rd
- 69 Denham Ave
- 5 Nottingham Cir
- 65 Marvel St
- 46 Lilac Ave
- 0 Bark St Unit 1342599
- 0 Bark St Unit 73152576
- 107 Manchester Ave
- 54 Grant Ave
- 30 Tennyson Dr
- 2714 Riverside Ave
- 210 Harrison Ave
- 0 Palmer St
- 1194 Sharps Lot Rd
- 33 Rhinecliffe Rd
- 316 High Hill Rd
- 4234 N Main St Unit 103
- 3636 N Main St Unit 5
- 34 Base Lodge Ln
Your Personal Tour Guide
Ask me questions while you tour the home.