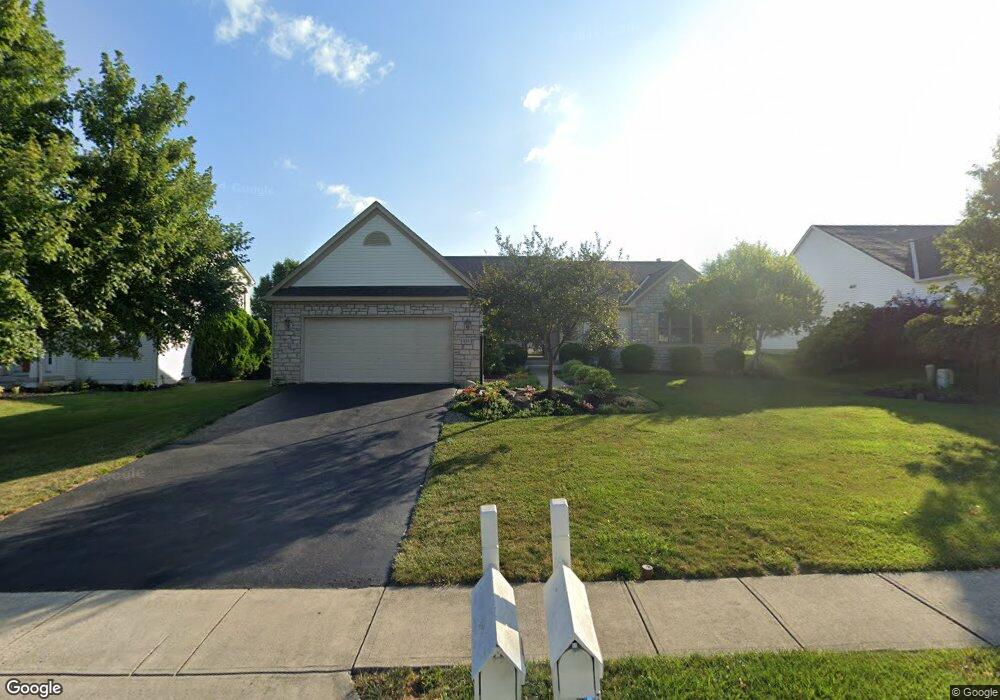
856 Delong St Pickerington, OH 43147
Estimated Value: $422,940 - $448,000
3
Beds
3
Baths
1,988
Sq Ft
$220/Sq Ft
Est. Value
About This Home
This home is located at 856 Delong St, Pickerington, OH 43147 and is currently estimated at $437,735, approximately $220 per square foot. 856 Delong St is a home located in Fairfield County with nearby schools including Pickerington Elementary School, Diley Middle School, and Pickerington Ridgeview Junior High School.
Ownership History
Date
Name
Owned For
Owner Type
Purchase Details
Closed on
Jul 24, 2019
Sold by
Graham Nadab H and Graham Ma Fanny
Bought by
Graham Ma Fanny
Current Estimated Value
Purchase Details
Closed on
Aug 1, 2006
Sold by
Dewitt Cheryl Ann and Jonard Barbara Joyce
Bought by
Graham Nadab H and Graham Ma Fanny
Home Financials for this Owner
Home Financials are based on the most recent Mortgage that was taken out on this home.
Original Mortgage
$50,000
Interest Rate
6.85%
Mortgage Type
Purchase Money Mortgage
Purchase Details
Closed on
Jan 6, 2005
Sold by
Thomas John M and Thomas Teresa A
Bought by
Kauffman Patricia A
Purchase Details
Closed on
May 29, 2001
Sold by
Rockford Homes Inc
Bought by
Thomas John M and Thomas Teresa A
Home Financials for this Owner
Home Financials are based on the most recent Mortgage that was taken out on this home.
Original Mortgage
$275,000
Interest Rate
7.07%
Mortgage Type
New Conventional
Create a Home Valuation Report for This Property
The Home Valuation Report is an in-depth analysis detailing your home's value as well as a comparison with similar homes in the area
Home Values in the Area
Average Home Value in this Area
Purchase History
| Date | Buyer | Sale Price | Title Company |
|---|---|---|---|
| Graham Ma Fanny | -- | None Available | |
| Graham Nadab H | $231,000 | The Talon Group | |
| Kauffman Patricia A | $232,500 | The Midland Celtic Title Gro | |
| Thomas John M | $209,755 | -- |
Source: Public Records
Mortgage History
| Date | Status | Borrower | Loan Amount |
|---|---|---|---|
| Open | Graham Nadab H | $50,000 | |
| Previous Owner | Thomas John M | $275,000 |
Source: Public Records
Tax History Compared to Growth
Tax History
| Year | Tax Paid | Tax Assessment Tax Assessment Total Assessment is a certain percentage of the fair market value that is determined by local assessors to be the total taxable value of land and additions on the property. | Land | Improvement |
|---|---|---|---|---|
| 2024 | $14,481 | $117,640 | $19,240 | $98,400 |
| 2023 | $5,546 | $117,640 | $19,240 | $98,400 |
| 2022 | $5,564 | $117,640 | $19,240 | $98,400 |
| 2021 | $5,222 | $94,020 | $18,330 | $75,690 |
| 2020 | $5,278 | $94,020 | $18,330 | $75,690 |
| 2019 | $5,312 | $94,020 | $18,330 | $75,690 |
| 2018 | $5,006 | $77,170 | $18,330 | $58,840 |
| 2017 | $5,013 | $77,230 | $18,390 | $58,840 |
| 2016 | $4,988 | $77,230 | $18,390 | $58,840 |
| 2015 | $4,777 | $69,940 | $16,000 | $53,940 |
| 2014 | $4,719 | $69,940 | $16,000 | $53,940 |
| 2013 | $4,719 | $69,940 | $16,000 | $53,940 |
Source: Public Records
Map
Nearby Homes
- 908 Washington St
- 0 Windmiller Dr
- 192 Kidbrooke Dr
- 161 Lorrimore Dr
- 157 Lorrimore Dr
- 184 Kidbrooke Dr
- 155 Lorrimore Dr
- 153 Lorrimore Dr
- 106 Portrait Cir
- 165 Norland Dr
- 165 Lorrimore Dr
- 1324 Brookview Cir
- 149 Lorrimore Dr
- 540 Fullers Cir Unit 103
- 183 Kidbrooke Dr
- 147 Lorrimore Dr
- 1179 Cambridge Way Unit 1179
- 123 Rolling Meadow Ct
- 145 Lorrimore Dr
- 1361 Eastwick Way
- 850 Delong St
- 850 Delong St Unit 10
- 860 Delong St
- 844 Delong St
- 864 Delong St Unit 7
- 857 Delong St
- 857 Delong St Unit 40
- 851 Delong St
- 840 Delong St
- 840 Delong St Unit 12
- 870 Delong St
- 865 Delong St
- 845 Delong St
- 871 Delong St
- 876 Delong St
- 834 Delong St
- 830 Ellis St
- 835 Delong St
- 834 Ellis St
- 826 Ellis St