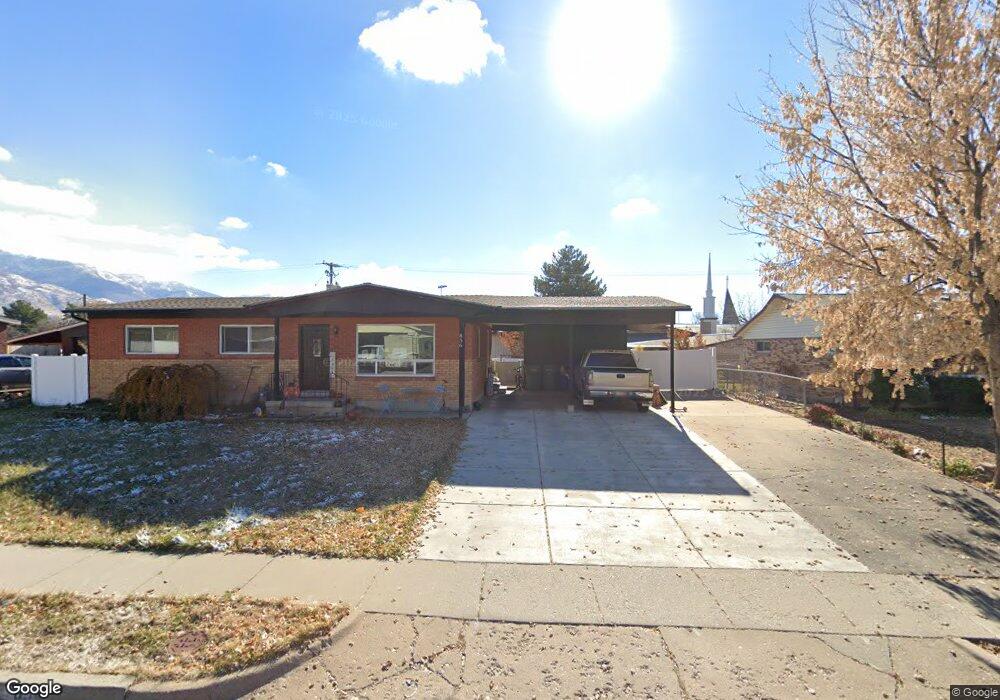
856 Elm St Layton, UT 84041
Estimated Value: $409,000 - $462,000
3
Beds
2
Baths
1,417
Sq Ft
$312/Sq Ft
Est. Value
About This Home
This home is located at 856 Elm St, Layton, UT 84041 and is currently estimated at $441,750, approximately $311 per square foot. 856 Elm St is a home located in Davis County with nearby schools including Whitesides Elementary School, Fairfield Junior High School, and Layton High School.
Ownership History
Date
Name
Owned For
Owner Type
Purchase Details
Closed on
Jan 27, 2000
Sold by
Mark Higley Construction Lc
Bought by
Moon Scott T and Moon Denice
Current Estimated Value
Home Financials for this Owner
Home Financials are based on the most recent Mortgage that was taken out on this home.
Original Mortgage
$120,000
Outstanding Balance
$38,213
Interest Rate
7.87%
Estimated Equity
$403,537
Purchase Details
Closed on
Jan 21, 2000
Sold by
Mark Higley Construction Lc
Bought by
Moon Scott T and Moon Denice
Home Financials for this Owner
Home Financials are based on the most recent Mortgage that was taken out on this home.
Original Mortgage
$120,000
Outstanding Balance
$38,213
Interest Rate
7.87%
Estimated Equity
$403,537
Purchase Details
Closed on
Aug 17, 1999
Sold by
Moon Scott T and Moon Denice
Bought by
Mark Higley Construction Lc
Home Financials for this Owner
Home Financials are based on the most recent Mortgage that was taken out on this home.
Original Mortgage
$93,000
Interest Rate
7.56%
Purchase Details
Closed on
Mar 1, 1999
Sold by
Hardy Raymond M and Hardy Eva E
Bought by
Moon Scott T and Moon Denice
Create a Home Valuation Report for This Property
The Home Valuation Report is an in-depth analysis detailing your home's value as well as a comparison with similar homes in the area
Home Values in the Area
Average Home Value in this Area
Purchase History
| Date | Buyer | Sale Price | Title Company |
|---|---|---|---|
| Moon Scott T | -- | Heritage West Title Insuranc | |
| Moon Scott T | -- | Heritage West Title Insuranc | |
| Mark Higley Construction Lc | -- | First American Title Co | |
| Moon Scott T | -- | -- |
Source: Public Records
Mortgage History
| Date | Status | Borrower | Loan Amount |
|---|---|---|---|
| Open | Moon Scott T | $120,000 | |
| Previous Owner | Mark Higley Construction Lc | $93,000 |
Source: Public Records
Tax History
| Year | Tax Paid | Tax Assessment Tax Assessment Total Assessment is a certain percentage of the fair market value that is determined by local assessors to be the total taxable value of land and additions on the property. | Land | Improvement |
|---|---|---|---|---|
| 2025 | $2,332 | $244,750 | $100,178 | $144,572 |
| 2024 | $2,242 | $237,051 | $116,837 | $120,214 |
| 2023 | $2,210 | $226,600 | $76,956 | $149,644 |
| 2022 | $2,309 | $425,000 | $133,953 | $291,047 |
| 2021 | $2,074 | $313,000 | $102,544 | $210,456 |
| 2020 | $1,864 | $270,000 | $86,619 | $183,381 |
| 2019 | $1,819 | $258,000 | $82,576 | $175,424 |
| 2018 | $1,643 | $234,000 | $82,576 | $151,424 |
| 2016 | $1,436 | $105,490 | $26,501 | $78,989 |
| 2015 | $1,363 | $95,040 | $26,501 | $68,539 |
| 2014 | $1,475 | $105,201 | $26,501 | $78,700 |
| 2013 | -- | $77,862 | $16,544 | $61,318 |
Source: Public Records
Map
Nearby Homes
- 9 Colonial Ave
- 187 N Talbot Dr
- 1137 Holmes Creek Ln
- 86 Mill Rd
- 617 E 405 S
- 149 N Fort Ln Unit 1D
- 1368 E 275 S
- 389 Morgan St
- 508 N Adamswood Rd
- 504 E Alice Way
- 679 S Clearwater Falls Dr
- 556 N Fairfield Rd Unit A2
- 556 N Fairfield Rd Unit D1
- 556 N Fairfield Rd Unit D2
- 556 N Fairfield Rd Unit A3
- 556 N Fairfield Rd Unit D3
- 556 N Fairfield Rd Unit D4
- 556 N Fairfield Rd Unit A1
- 556 N Fairfield Rd Unit A4
- 464 E Alice Way
Your Personal Tour Guide
Ask me questions while you tour the home.