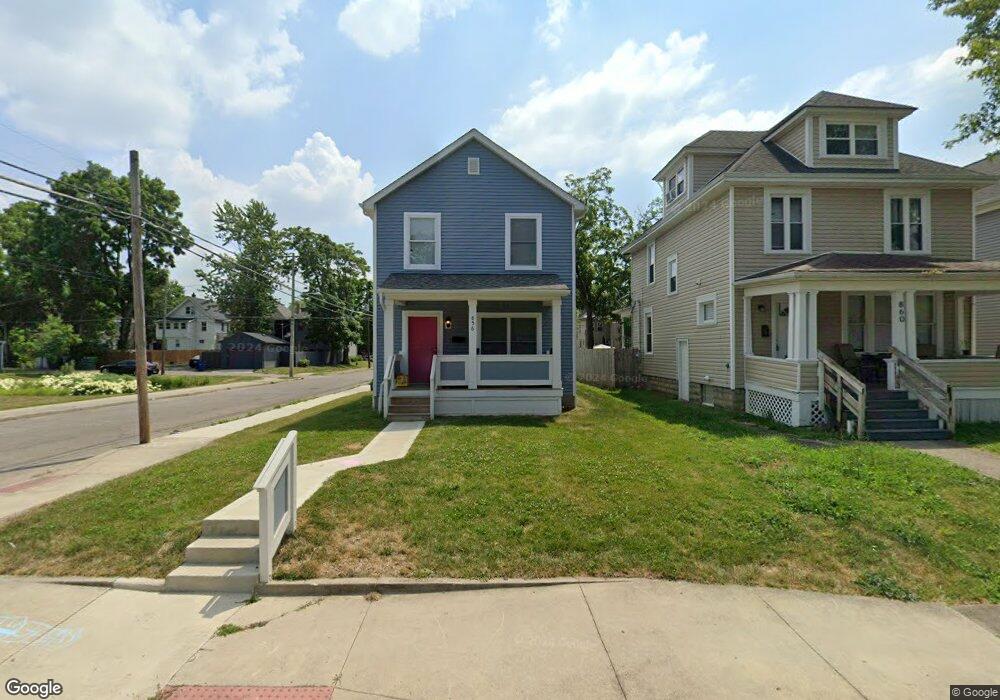
856 Gilbert St Columbus, OH 43206
Southern Orchards NeighborhoodEstimated Value: $226,000 - $308,000
2
Beds
1
Bath
1,320
Sq Ft
$201/Sq Ft
Est. Value
About This Home
This home is located at 856 Gilbert St, Columbus, OH 43206 and is currently estimated at $265,529, approximately $201 per square foot. 856 Gilbert St is a home located in Franklin County with nearby schools including Livingston Elementary School, South High School, and Capital Collegiate Preparatory Academy.
Ownership History
Date
Name
Owned For
Owner Type
Purchase Details
Closed on
Feb 18, 2022
Sold by
City Of Columbus Ohio
Bought by
Healthy Rental Homes Vi Llc
Current Estimated Value
Purchase Details
Closed on
Jan 28, 2022
Sold by
City Of Columbus Ohio
Bought by
Healthy Rental Homes Vi Llc
Purchase Details
Closed on
Jul 21, 2021
Sold by
Central Ohio Community Improvement Corp
Bought by
City Of Columbus
Purchase Details
Closed on
Jul 19, 2021
Sold by
City Of Columbus Ohio
Bought by
Healthy Rental Homes Vi Llc
Purchase Details
Closed on
Jan 4, 2017
Sold by
City Of Columbus
Bought by
Centarl Ohio Community Improvement Corpo
Purchase Details
Closed on
Nov 17, 2016
Sold by
Tip Marketing Llc
Bought by
City Of Columbus
Purchase Details
Closed on
Sep 3, 2008
Sold by
Lwbr Llc
Bought by
Tip Marketing Llc
Home Financials for this Owner
Home Financials are based on the most recent Mortgage that was taken out on this home.
Original Mortgage
$25,000
Interest Rate
6.55%
Mortgage Type
Purchase Money Mortgage
Purchase Details
Closed on
May 8, 2008
Sold by
The Bank Of New York Trust Co
Bought by
Lwbr Llc
Purchase Details
Closed on
Jun 11, 2007
Sold by
Murray Ethel M and Case #06Cve11 14347
Bought by
The Bank Of New York Trust Na
Purchase Details
Closed on
May 10, 2004
Sold by
Naumoff Properties Llc
Bought by
Murray Ethel M
Home Financials for this Owner
Home Financials are based on the most recent Mortgage that was taken out on this home.
Original Mortgage
$73,150
Interest Rate
5.85%
Mortgage Type
Purchase Money Mortgage
Purchase Details
Closed on
Nov 12, 2003
Sold by
Mid State Homes Inc
Bought by
Naumoff Properties Llc
Purchase Details
Closed on
Sep 19, 2003
Sold by
Hensley Leona and Williams Chestina Jean
Bought by
Mid State Homes Inc
Purchase Details
Closed on
Sep 17, 1992
Bought by
Hensley Leona
Create a Home Valuation Report for This Property
The Home Valuation Report is an in-depth analysis detailing your home's value as well as a comparison with similar homes in the area
Home Values in the Area
Average Home Value in this Area
Purchase History
| Date | Buyer | Sale Price | Title Company |
|---|---|---|---|
| Healthy Rental Homes Vi Llc | $1,960 | Bennington Jeff | |
| Healthy Rental Homes Vi Llc | $1,960 | Bennington Jeff | |
| City Of Columbus | -- | None Available | |
| Healthy Rental Homes Vi Llc | $1,960 | Bennington Jeff | |
| Centarl Ohio Community Improvement Corpo | -- | None Available | |
| City Of Columbus | -- | None Available | |
| Tip Marketing Llc | $9,000 | Northwest T | |
| Lwbr Llc | $5,250 | Resource Title Agency Inc | |
| The Bank Of New York Trust Na | $30,000 | None Available | |
| Murray Ethel M | $77,000 | -- | |
| Naumoff Properties Llc | $25,000 | -- | |
| Mid State Homes Inc | $25,500 | Ohio Title Agency | |
| Hensley Leona | -- | -- |
Source: Public Records
Mortgage History
| Date | Status | Borrower | Loan Amount |
|---|---|---|---|
| Previous Owner | Tip Marketing Llc | $25,000 | |
| Previous Owner | Murray Ethel M | $73,150 |
Source: Public Records
Tax History
| Year | Tax Paid | Tax Assessment Tax Assessment Total Assessment is a certain percentage of the fair market value that is determined by local assessors to be the total taxable value of land and additions on the property. | Land | Improvement |
|---|---|---|---|---|
| 2025 | $1,070 | $75,150 | $23,350 | $51,800 |
| 2024 | $1,070 | $75,150 | $23,350 | $51,800 |
| 2023 | $1,128 | $75,150 | $23,350 | $51,800 |
| 2022 | $0 | $4,200 | $4,200 | $0 |
| 2021 | $0 | $4,200 | $4,200 | $0 |
| 2020 | $0 | $4,200 | $4,200 | $0 |
| 2019 | $306 | $3,220 | $3,220 | $0 |
| 2018 | $306 | $3,220 | $3,220 | $0 |
| 2017 | $106 | $16,030 | $3,220 | $12,810 |
| 2016 | $5,447 | $6,650 | $2,520 | $4,130 |
| 2015 | $612 | $6,650 | $2,520 | $4,130 |
| 2014 | $412 | $6,650 | $2,520 | $4,130 |
| 2013 | $532 | $7,000 | $2,660 | $4,340 |
Source: Public Records
Map
Nearby Homes
- 870 Gilbert St
- 932 Wagner St
- 867 S 22nd St
- 863 Carpenter St
- 935 S Ohio Ave
- 960 Carpenter St
- 800 Carpenter St
- 918 S Ohio Ave
- 999 S 22nd St
- 901 Heyl Ave
- 943 S Champion Ave
- 779-781 Stanley Ave
- 903 E Livingston Ave
- 883 E Whittier St
- 786 S Ohio Ave
- 741 Heyl Ave
- 904 E Livingston Ave
- 993 Oakwood Ave
- 941-945 E Whittier St
- 711 S 22nd St
- 860 Gilbert St
- 864 Gilbert St
- 885 Forest St
- 846 Gilbert St
- 842 Gilbert St
- 874 Gilbert St
- 838 Gilbert St
- 855 Gilbert St Unit 857
- 878 Gilbert St
- 843 Gilbert St
- 834 Gilbert St
- 871 Gilbert St
- 867 Gilbert St
- 861 S 22nd St Unit 863
- 841 Gilbert St
- 875 Gilbert St
- 882 Gilbert St
- 871 S 22nd St
- 839 Gilbert St
- 830 Gilbert St
Your Personal Tour Guide
Ask me questions while you tour the home.