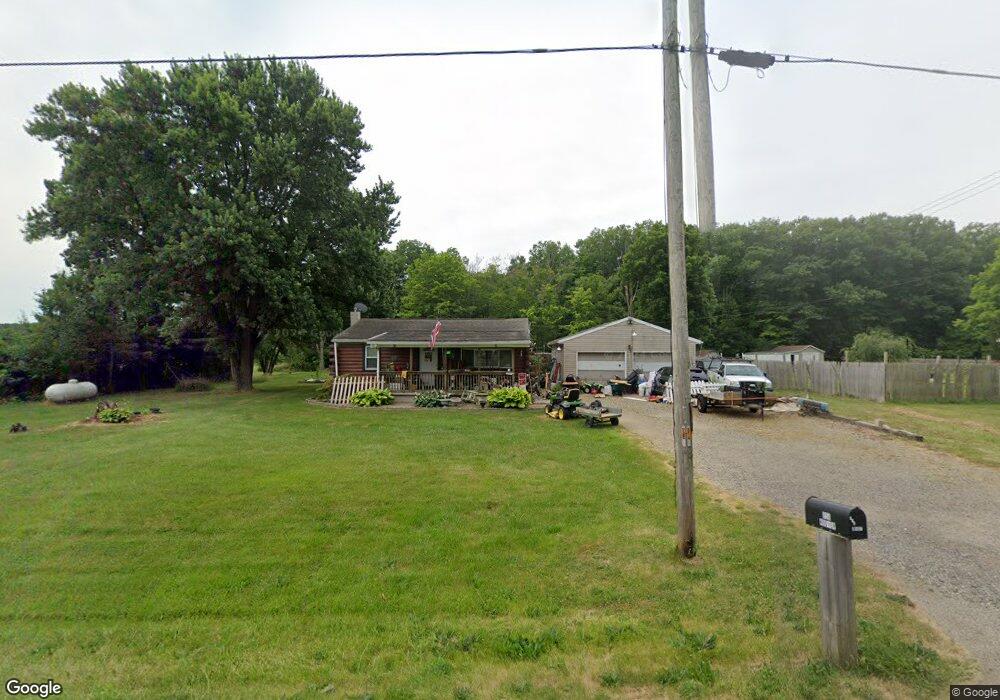
856 Hoover Rd Mansfield, OH 44905
Estimated Value: $170,000 - $228,000
3
Beds
1
Bath
1,260
Sq Ft
$153/Sq Ft
Est. Value
About This Home
This home is located at 856 Hoover Rd, Mansfield, OH 44905 and is currently estimated at $192,202, approximately $152 per square foot. 856 Hoover Rd is a home located in Richland County with nearby schools including Madison High School, Temple-Christian School, and St. Mary Catholic School.
Ownership History
Date
Name
Owned For
Owner Type
Purchase Details
Closed on
Oct 2, 2018
Sold by
Lambert Starlia and Bandy Starlia
Bought by
Bandy Douglas
Current Estimated Value
Purchase Details
Closed on
Oct 23, 2007
Sold by
Ardis Frank A and Ardis Melissa
Bought by
Bandy Douglas and Bandy Douglas
Home Financials for this Owner
Home Financials are based on the most recent Mortgage that was taken out on this home.
Original Mortgage
$94,516
Outstanding Balance
$59,374
Interest Rate
6.33%
Mortgage Type
FHA
Estimated Equity
$132,828
Purchase Details
Closed on
Jul 1, 1997
Sold by
Henson Phillip J
Bought by
Ardis Frank A and Ardis Teresa M
Home Financials for this Owner
Home Financials are based on the most recent Mortgage that was taken out on this home.
Original Mortgage
$48,638
Interest Rate
8%
Mortgage Type
New Conventional
Create a Home Valuation Report for This Property
The Home Valuation Report is an in-depth analysis detailing your home's value as well as a comparison with similar homes in the area
Home Values in the Area
Average Home Value in this Area
Purchase History
| Date | Buyer | Sale Price | Title Company |
|---|---|---|---|
| Bandy Douglas | -- | None Available | |
| Bandy Douglas | $96,000 | Lawyers Title | |
| Ardis Frank A | $62,500 | -- |
Source: Public Records
Mortgage History
| Date | Status | Borrower | Loan Amount |
|---|---|---|---|
| Open | Bandy Douglas | $94,516 | |
| Previous Owner | Ardis Frank A | $48,638 |
Source: Public Records
Tax History Compared to Growth
Tax History
| Year | Tax Paid | Tax Assessment Tax Assessment Total Assessment is a certain percentage of the fair market value that is determined by local assessors to be the total taxable value of land and additions on the property. | Land | Improvement |
|---|---|---|---|---|
| 2024 | $1,800 | $37,110 | $11,090 | $26,020 |
| 2023 | $1,800 | $37,110 | $11,090 | $26,020 |
| 2022 | $1,537 | $28,160 | $9,910 | $18,250 |
| 2021 | $1,537 | $28,160 | $9,910 | $18,250 |
| 2020 | $1,549 | $28,160 | $9,910 | $18,250 |
| 2019 | $1,492 | $24,110 | $8,400 | $15,710 |
| 2018 | $1,394 | $24,110 | $8,400 | $15,710 |
| 2017 | $1,373 | $24,110 | $8,400 | $15,710 |
| 2016 | $1,380 | $23,550 | $7,980 | $15,570 |
| 2015 | $1,316 | $23,550 | $7,980 | $15,570 |
| 2014 | $1,312 | $23,550 | $7,980 | $15,570 |
| 2012 | $652 | $24,790 | $8,400 | $16,390 |
Source: Public Records
Map
Nearby Homes
- 0 Hoover Rd
- 920 Piper Rd
- 1171 Hoover Rd
- 1585 Beal Rd
- 1791 Beal Rd
- 1292 Wolford Rd
- 1245 N Stewart Rd
- 1158 Delwood Rd
- 1150 Delwood Dr
- 1140 5th Ave
- 1151 Beal Rd
- 0 Wesley
- 1106 Keller Dr Unit 1108
- 741 Yale Ave
- 735 Pennsylvania Ave
- 903 Mayflower Ave
- 1199 Evergreen Ave W
- 1183 Evergreen Ave W
- 1806 Richard Dr
- 683 Coachman Rd