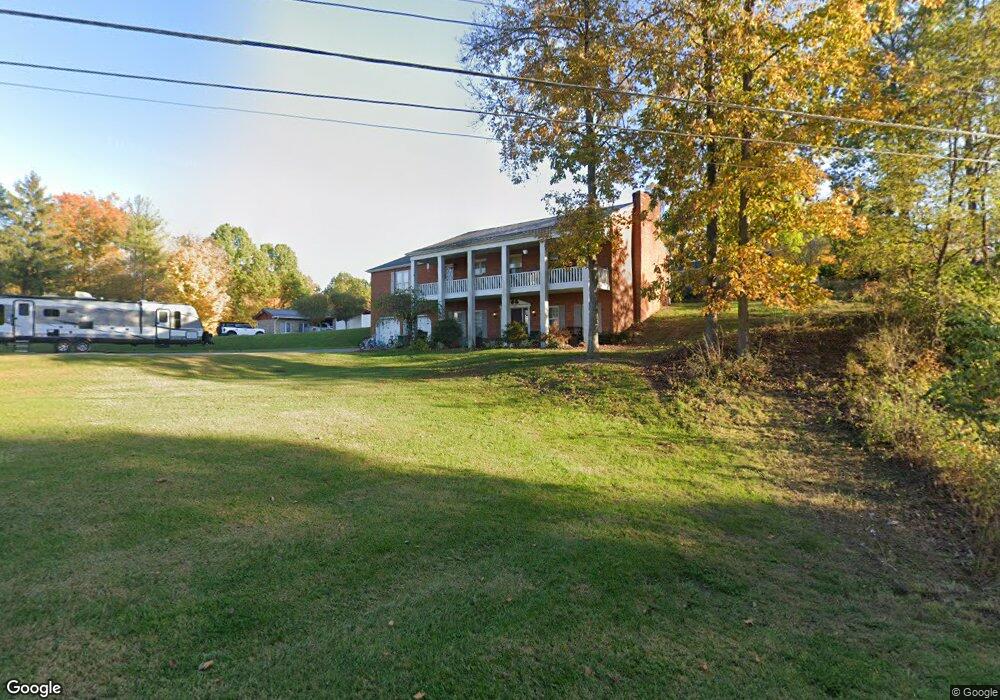
856 Howard Rd Waverly, OH 45690
Estimated Value: $404,358 - $452,000
4
Beds
4
Baths
1,856
Sq Ft
$229/Sq Ft
Est. Value
About This Home
This home is located at 856 Howard Rd, Waverly, OH 45690 and is currently estimated at $425,340, approximately $229 per square foot. 856 Howard Rd is a home located in Pike County with nearby schools including Waverly Primary School, Waverly Intermediate School, and Waverly Junior High School.
Ownership History
Date
Name
Owned For
Owner Type
Purchase Details
Closed on
Jul 6, 2017
Sold by
Patrick Lane G and Patrick Robin L
Bought by
Roberts Bryan and Roberts Valena
Current Estimated Value
Home Financials for this Owner
Home Financials are based on the most recent Mortgage that was taken out on this home.
Original Mortgage
$152,600
Outstanding Balance
$126,993
Interest Rate
3.95%
Mortgage Type
New Conventional
Estimated Equity
$298,347
Purchase Details
Closed on
Aug 8, 2006
Sold by
Robinson Roger and Robinson Linda
Bought by
Patrick Lane G and Patrick Robin L
Create a Home Valuation Report for This Property
The Home Valuation Report is an in-depth analysis detailing your home's value as well as a comparison with similar homes in the area
Home Values in the Area
Average Home Value in this Area
Purchase History
| Date | Buyer | Sale Price | Title Company |
|---|---|---|---|
| Roberts Bryan | $218,000 | None Available | |
| Patrick Lane G | $195,000 | None Available |
Source: Public Records
Mortgage History
| Date | Status | Borrower | Loan Amount |
|---|---|---|---|
| Open | Roberts Bryan | $152,600 |
Source: Public Records
Tax History
| Year | Tax Paid | Tax Assessment Tax Assessment Total Assessment is a certain percentage of the fair market value that is determined by local assessors to be the total taxable value of land and additions on the property. | Land | Improvement |
|---|---|---|---|---|
| 2024 | $3,682 | $111,880 | $11,130 | $100,750 |
| 2023 | $3,682 | $111,880 | $11,130 | $100,750 |
| 2022 | $3,146 | $83,810 | $11,130 | $72,680 |
| 2021 | $3,172 | $86,280 | $11,130 | $75,150 |
| 2020 | $3,181 | $86,280 | $11,130 | $75,150 |
| 2019 | $2,783 | $75,700 | $9,770 | $65,930 |
| 2018 | $2,685 | $80,870 | $9,770 | $71,100 |
| 2017 | $2,665 | $80,870 | $9,770 | $71,100 |
| 2016 | $2,397 | $63,840 | $3,430 | $60,410 |
| 2015 | $2,398 | $63,840 | $3,430 | $60,410 |
| 2014 | $2,313 | $63,840 | $3,430 | $60,410 |
| 2013 | $2,346 | $63,840 | $3,430 | $60,410 |
| 2012 | $2,407 | $63,840 | $3,430 | $60,410 |
Source: Public Records
Map
Nearby Homes