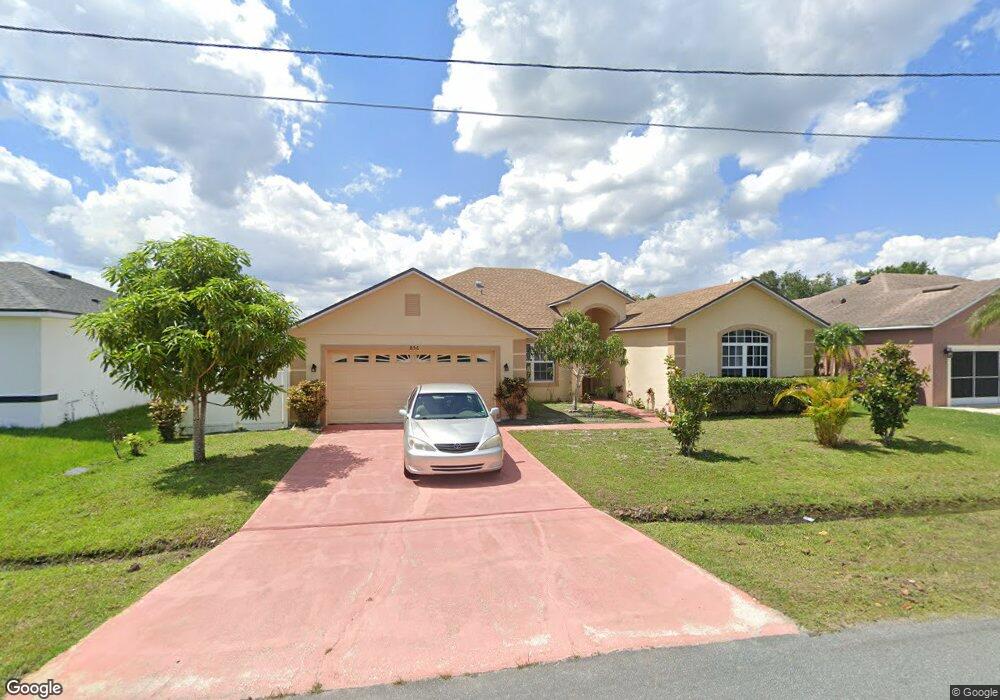
856 Massy Ct Kissimmee, FL 34759
Estimated Value: $321,000 - $373,000
4
Beds
3
Baths
2,356
Sq Ft
$144/Sq Ft
Est. Value
About This Home
This home is located at 856 Massy Ct, Kissimmee, FL 34759 and is currently estimated at $339,500, approximately $144 per square foot. 856 Massy Ct is a home located in Osceola County with nearby schools including Chestnut Elementary School For Science And Engineering, Discovery Intermediate School, and Liberty High School.
Ownership History
Date
Name
Owned For
Owner Type
Purchase Details
Closed on
Aug 12, 2021
Sold by
Glemaud Denise J and Francoeur Assade
Bought by
Glemaud Denise J
Current Estimated Value
Home Financials for this Owner
Home Financials are based on the most recent Mortgage that was taken out on this home.
Original Mortgage
$120,000
Outstanding Balance
$108,953
Interest Rate
2.8%
Mortgage Type
New Conventional
Estimated Equity
$230,547
Purchase Details
Closed on
Jan 23, 2017
Sold by
Glemaud Denise J
Bought by
Glemaud Sophia I and Glemaud Karyn E
Purchase Details
Closed on
Jan 1, 2017
Bought by
Glemaud Denise J Rle
Purchase Details
Closed on
Sep 20, 2002
Sold by
Avatar Prop Inc
Bought by
Glemaud Denise J
Home Financials for this Owner
Home Financials are based on the most recent Mortgage that was taken out on this home.
Original Mortgage
$123,400
Interest Rate
6.3%
Mortgage Type
Purchase Money Mortgage
Create a Home Valuation Report for This Property
The Home Valuation Report is an in-depth analysis detailing your home's value as well as a comparison with similar homes in the area
Home Values in the Area
Average Home Value in this Area
Purchase History
| Date | Buyer | Sale Price | Title Company |
|---|---|---|---|
| Glemaud Denise J | -- | Avenue 365 Lender Svcs Llc | |
| Glemaud Sophia I | -- | None Available | |
| Glemaud Denise J Rle | $100 | -- | |
| Glemaud Denise J | $137,200 | -- |
Source: Public Records
Mortgage History
| Date | Status | Borrower | Loan Amount |
|---|---|---|---|
| Open | Glemaud Denise J | $120,000 | |
| Previous Owner | Glemaud Denise J | $123,400 |
Source: Public Records
Tax History Compared to Growth
Tax History
| Year | Tax Paid | Tax Assessment Tax Assessment Total Assessment is a certain percentage of the fair market value that is determined by local assessors to be the total taxable value of land and additions on the property. | Land | Improvement |
|---|---|---|---|---|
| 2024 | $3,825 | $193,829 | -- | -- |
| 2023 | $3,825 | $188,184 | $0 | $0 |
| 2022 | $2,569 | $182,703 | $0 | $0 |
| 2021 | $2,544 | $177,382 | $0 | $0 |
| 2020 | $2,495 | $174,933 | $0 | $0 |
| 2019 | $2,453 | $171,000 | $19,000 | $152,000 |
| 2018 | $2,585 | $153,800 | $14,200 | $139,600 |
| 2017 | $2,407 | $135,600 | $11,400 | $124,200 |
| 2016 | $2,274 | $127,800 | $13,300 | $114,500 |
| 2015 | $2,169 | $119,700 | $13,300 | $106,400 |
| 2014 | $1,942 | $103,200 | $16,000 | $87,200 |
Source: Public Records
Map
Nearby Homes