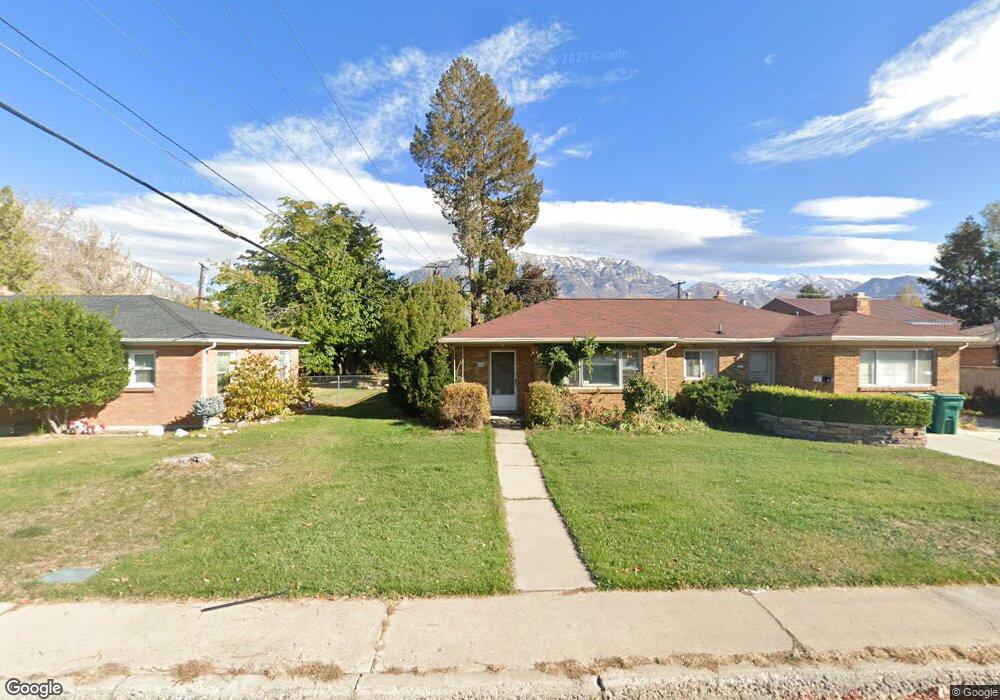
856 N 100 W Orem, UT 84057
Windsor NeighborhoodEstimated Value: $462,000 - $606,000
3
Beds
2
Baths
1,456
Sq Ft
$344/Sq Ft
Est. Value
About This Home
This home is located at 856 N 100 W, Orem, UT 84057 and is currently estimated at $500,212, approximately $343 per square foot. 856 N 100 W is a home located in Utah County with nearby schools including Windsor School, Canyon View Junior High School, and Timpanogos High School.
Ownership History
Date
Name
Owned For
Owner Type
Purchase Details
Closed on
Mar 22, 2012
Sold by
Finlinson Jan Frank and Finlinson Jennifer D
Bought by
Finlinson Jan Frank
Current Estimated Value
Purchase Details
Closed on
Nov 22, 2002
Sold by
Finlinson Jan Frank
Bought by
Finlinson Jan Frank and Finlinson Jennifer D
Home Financials for this Owner
Home Financials are based on the most recent Mortgage that was taken out on this home.
Original Mortgage
$116,000
Outstanding Balance
$48,945
Interest Rate
6.12%
Estimated Equity
$451,267
Purchase Details
Closed on
Jun 5, 1996
Sold by
Cosgrove Anna T and Cosgrove Thomas J
Bought by
Candland John W and Candland Maxine S
Home Financials for this Owner
Home Financials are based on the most recent Mortgage that was taken out on this home.
Original Mortgage
$104,959
Interest Rate
7.96%
Mortgage Type
FHA
Create a Home Valuation Report for This Property
The Home Valuation Report is an in-depth analysis detailing your home's value as well as a comparison with similar homes in the area
Home Values in the Area
Average Home Value in this Area
Purchase History
| Date | Buyer | Sale Price | Title Company |
|---|---|---|---|
| Finlinson Jan Frank | -- | Cornerstone Title Insurance | |
| Finlinson Jan Frank | -- | Old Republic Title Company | |
| Finlinson Jan Frank | -- | Old Republic Title Company | |
| Candland John W | -- | First American |
Source: Public Records
Mortgage History
| Date | Status | Borrower | Loan Amount |
|---|---|---|---|
| Open | Finlinson Jan Frank | $116,000 | |
| Closed | Candland John W | $104,959 |
Source: Public Records
Tax History
| Year | Tax Paid | Tax Assessment Tax Assessment Total Assessment is a certain percentage of the fair market value that is determined by local assessors to be the total taxable value of land and additions on the property. | Land | Improvement |
|---|---|---|---|---|
| 2025 | $1,859 | $226,710 | -- | -- |
| 2024 | $1,859 | $227,260 | $0 | $0 |
| 2023 | $1,731 | $227,480 | $0 | $0 |
| 2022 | $1,719 | $218,845 | $0 | $0 |
| 2021 | $1,469 | $283,200 | $141,500 | $141,700 |
| 2020 | $1,330 | $252,100 | $113,200 | $138,900 |
| 2019 | $1,224 | $241,200 | $102,300 | $138,900 |
| 2018 | $1,128 | $212,400 | $91,300 | $121,100 |
| 2017 | $1,051 | $106,040 | $0 | $0 |
| 2016 | $970 | $90,255 | $0 | $0 |
| 2015 | $937 | $82,390 | $0 | $0 |
| 2014 | $861 | $75,405 | $0 | $0 |
Source: Public Records
Map
Nearby Homes
Your Personal Tour Guide
Ask me questions while you tour the home.