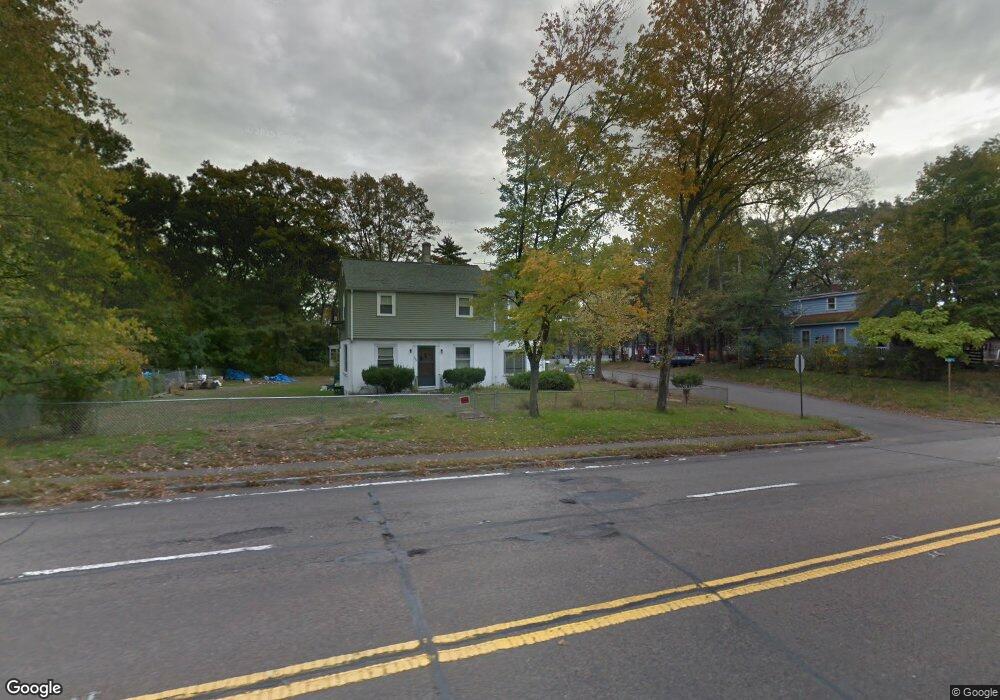
856 Newport Ave Attleboro, MA 02703
Estimated Value: $420,374 - $530,000
3
Beds
2
Baths
1,610
Sq Ft
$290/Sq Ft
Est. Value
About This Home
This home is located at 856 Newport Ave, Attleboro, MA 02703 and is currently estimated at $466,344, approximately $289 per square foot. 856 Newport Ave is a home located in Bristol County with nearby schools including Hill-Roberts Elementary School, Robert J. Coelho Middle School, and Attleboro High School.
Ownership History
Date
Name
Owned For
Owner Type
Purchase Details
Closed on
Jun 6, 2018
Sold by
Deangelis Steven R
Bought by
Deangelis Melissa A and Deangelis Steven R
Current Estimated Value
Purchase Details
Closed on
Apr 18, 2012
Sold by
Deangelis Mary T and Deangelis Rocco R
Bought by
Deangelis Steven R
Purchase Details
Closed on
Apr 3, 2009
Sold by
Deangelis Mary T
Bought by
Deangelis Mary T and Deangelis Rocco R
Purchase Details
Closed on
Aug 20, 2004
Sold by
Nobrega Constance M and Nobrega Manuel E
Bought by
Nobrega Constance M
Create a Home Valuation Report for This Property
The Home Valuation Report is an in-depth analysis detailing your home's value as well as a comparison with similar homes in the area
Home Values in the Area
Average Home Value in this Area
Purchase History
| Date | Buyer | Sale Price | Title Company |
|---|---|---|---|
| Deangelis Melissa A | -- | -- | |
| Deangelis Steven R | -- | -- | |
| Deangelis Mary T | -- | -- | |
| Nobrega Constance M | -- | -- |
Source: Public Records
Tax History Compared to Growth
Tax History
| Year | Tax Paid | Tax Assessment Tax Assessment Total Assessment is a certain percentage of the fair market value that is determined by local assessors to be the total taxable value of land and additions on the property. | Land | Improvement |
|---|---|---|---|---|
| 2025 | $3,932 | $313,300 | $139,300 | $174,000 |
| 2024 | $3,888 | $305,400 | $139,300 | $166,100 |
| 2023 | $3,632 | $265,300 | $126,700 | $138,600 |
| 2022 | $3,546 | $245,400 | $120,900 | $124,500 |
| 2021 | $3,536 | $238,900 | $116,300 | $122,600 |
| 2020 | $3,400 | $233,500 | $112,900 | $120,600 |
| 2019 | $3,304 | $233,300 | $110,700 | $122,600 |
| 2018 | $2,338 | $219,500 | $107,500 | $112,000 |
| 2017 | $3,202 | $220,100 | $107,500 | $112,600 |
| 2016 | $3,105 | $209,500 | $100,600 | $108,900 |
| 2015 | $3,041 | $206,700 | $100,600 | $106,100 |
| 2014 | $2,980 | $200,700 | $95,300 | $105,400 |
Source: Public Records
Map
Nearby Homes
- 39 Slade Ave
- 44 Buffington St
- 130 Zoar Ave
- 980 Newport Ave
- 12 Tyson Place
- 23 Magnolia St Unit 2
- 64 Highland Ave Unit A
- 64 Highland Ave Unit B
- 59 Samuel Way
- 2 Gardner Ave
- 49 Gardner Ave
- 52 Curtis Ave
- 103 Hall Ave
- 1 Jessicas Way
- 56 Liberty Dr
- 53 Liberty Dr
- 58 Baltic St Unit 58
- 56 Baltic St Unit 56
- 48 Liberty Dr
- 27 Killarney Way