856 Pitkin Loop San Jose, CA 95125
South San Jose NeighborhoodEstimated Value: $1,884,000 - $2,085,296
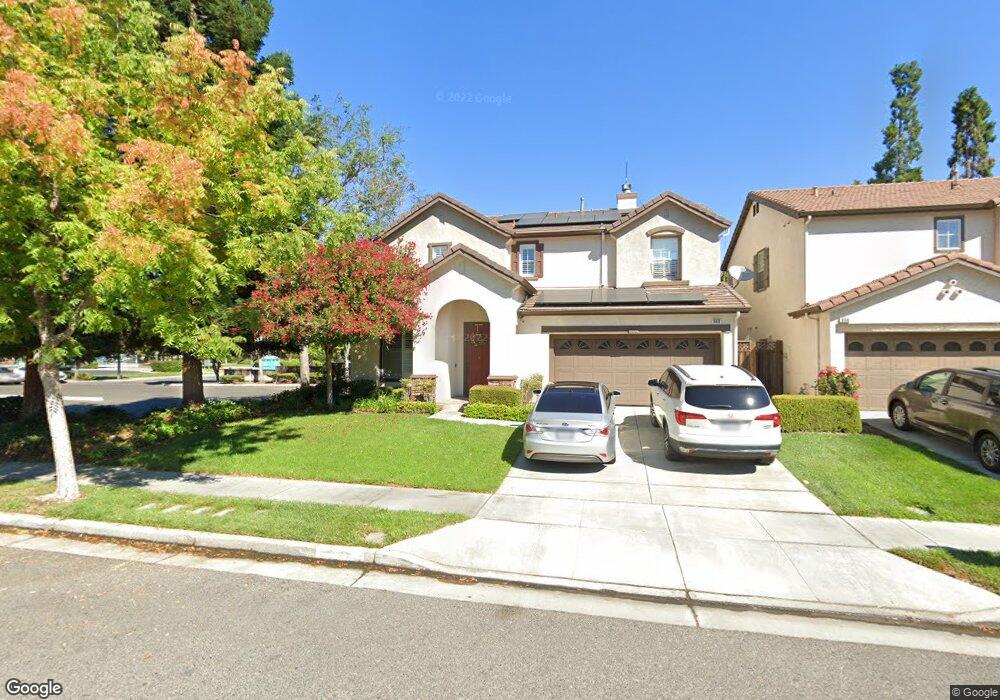
About This Home
This home is located at 856 Pitkin Loop, San Jose, CA 95125 and is currently estimated at $1,985,074, approximately $817 per square foot. 856 Pitkin Loop is a home located in Santa Clara County with nearby schools including Canoas Elementary School, John Muir Middle School, and Gunderson High School.
Ownership History
We collect this data history from publicly available records. To have your information removed, we recommend requesting removal directly through your county’s website.
Purchase Details
Purchase Details
Home Financials for this Owner
Home Financials are based on the most recent Mortgage that was taken out on this home.Home Values in the Area
Average Home Value in this Area
Purchase History
We collect this data history from publicly available records. To have your information removed, we recommend requesting removal directly through your county’s website.
| Date | Buyer | Sale Price | Title Company |
|---|---|---|---|
| -- | None Listed On Document | ||
| $507,000 | First American Title Guarant |
Mortgage History
We collect this data history from publicly available records. To have your information removed, we recommend requesting removal directly through your county’s website.
| Date | Status | Borrower | Loan Amount |
|---|---|---|---|
| Previous Owner | $405,300 | ||
| Closed | $50,000 |
Tax History
We collect this data history from publicly available records. To have your information removed, we recommend requesting removal directly through your county’s website.
| Year | Tax Paid | Tax Assessment Tax Assessment Total Assessment is a certain percentage of the fair market value that is determined by local assessors to be the total taxable value of land and additions on the property. | Land | Improvement |
|---|---|---|---|---|
| 2025 | $10,267 | $778,614 | $353,495 | $425,119 |
| 2024 | $10,267 | $763,348 | $346,564 | $416,784 |
| 2023 | $10,060 | $748,381 | $339,769 | $408,612 |
| 2022 | $9,973 | $733,707 | $333,107 | $400,600 |
| 2021 | $9,755 | $719,322 | $326,576 | $392,746 |
| 2020 | $9,523 | $711,947 | $323,228 | $388,719 |
| 2019 | $9,314 | $697,989 | $316,891 | $381,098 |
| 2018 | $9,215 | $684,304 | $310,678 | $373,626 |
| 2017 | $9,137 | $670,887 | $304,587 | $366,300 |
| 2016 | $8,959 | $657,733 | $298,615 | $359,118 |
| 2015 | $8,896 | $647,854 | $294,130 | $353,724 |
| 2014 | $8,444 | $635,165 | $288,369 | $346,796 |
Map
- 3009 Rubino Cir
- 2779 Parasol Ct
- 725 Canoas Creek Cir
- 700 Portofino Place
- 725 Portofino Place
- 914 Ironwood Dr
- 163 Mountain Springs Dr
- 532A Mill Pond Dr Unit 532 A
- 807 Batista Dr Unit 530
- 2905 Cambridge Dr
- 879 El Rio Dr
- 1133 Shenandoah Dr
- 524 Mill Pond Dr Unit 524
- 2264 Almaden Rd Unit B
- 213 Mountain Springs Dr Unit 213
- 625 Hillsdale Ave Unit 109
- 1148 Husted Ave
- 1126 Shenandoah Dr
- 1111 Mayette Ave
- 3112 Heather Ridge Dr Unit 112
- 860 Pitkin Loop
- 2644 Nightingale Dr
- 2610 Bobolink Dr
- 2615 Nightingale Dr
- 2638 Nightingale Dr
- 2632 Nightingale Dr
- 857 Pitkin Loop
- 861 Pitkin Loop
- 2620 Nightingale Dr
- 2609 Nightingale Dr
- 2756 Blaine Ct
- 2614 Nightingale Dr
- 2751 Blaine Ct
- 2604 Bobolink Dr
- 2603 Nightingale Dr
- 2762 Blaine Ct
- 2610 Nightingale Dr
- 2757 Blaine Ct
- 2752 Hageman Ct
- 2763 Blaine Ct
Ask me questions while you tour the home.