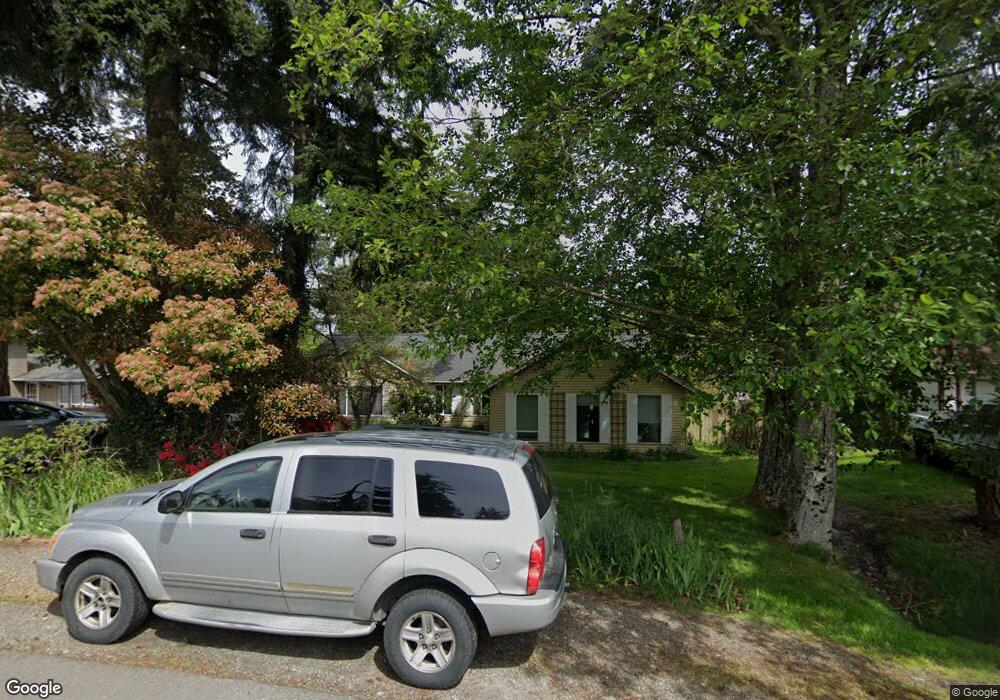
856 St Andrews Way Bellingham, WA 98229
Estimated Value: $578,000 - $745,000
3
Beds
2
Baths
1,728
Sq Ft
$382/Sq Ft
Est. Value
About This Home
This home is located at 856 St Andrews Way, Bellingham, WA 98229 and is currently estimated at $660,871, approximately $382 per square foot. 856 St Andrews Way is a home located in Whatcom County with nearby schools including Wade King Elementary School, Fairhaven Middle School, and Sehome High School.
Ownership History
Date
Name
Owned For
Owner Type
Purchase Details
Closed on
May 15, 2003
Sold by
Cathcart Thomas J and Davis Carla R
Bought by
Lorden Phillip B and Lorden Rebekah F
Current Estimated Value
Home Financials for this Owner
Home Financials are based on the most recent Mortgage that was taken out on this home.
Original Mortgage
$152,605
Outstanding Balance
$66,228
Interest Rate
5.77%
Mortgage Type
FHA
Estimated Equity
$594,643
Purchase Details
Closed on
Oct 12, 1999
Sold by
Bird Gene R and Bird Melissa A
Bought by
Cathcart Thomas J and Davis Carla R
Home Financials for this Owner
Home Financials are based on the most recent Mortgage that was taken out on this home.
Original Mortgage
$118,750
Interest Rate
5.32%
Create a Home Valuation Report for This Property
The Home Valuation Report is an in-depth analysis detailing your home's value as well as a comparison with similar homes in the area
Home Values in the Area
Average Home Value in this Area
Purchase History
| Date | Buyer | Sale Price | Title Company |
|---|---|---|---|
| Lorden Phillip B | $133,230 | Chicago Title Insurance | |
| Cathcart Thomas J | $107,443 | Whatcom Land Title Company I |
Source: Public Records
Mortgage History
| Date | Status | Borrower | Loan Amount |
|---|---|---|---|
| Open | Lorden Phillip B | $152,605 | |
| Previous Owner | Cathcart Thomas J | $118,750 |
Source: Public Records
Tax History Compared to Growth
Tax History
| Year | Tax Paid | Tax Assessment Tax Assessment Total Assessment is a certain percentage of the fair market value that is determined by local assessors to be the total taxable value of land and additions on the property. | Land | Improvement |
|---|---|---|---|---|
| 2024 | $4,654 | $536,346 | $244,963 | $291,383 |
| 2023 | $4,654 | $555,521 | $253,721 | $301,800 |
| 2022 | $4,009 | $472,787 | $215,934 | $256,853 |
| 2021 | $3,572 | $381,290 | $174,145 | $207,145 |
| 2020 | $3,497 | $334,463 | $152,758 | $181,705 |
| 2019 | $2,838 | $317,477 | $145,000 | $172,477 |
| 2018 | $2,957 | $258,585 | $98,735 | $159,850 |
| 2017 | $2,612 | $229,530 | $87,640 | $141,890 |
| 2016 | $2,365 | $211,375 | $80,640 | $130,735 |
| 2015 | $2,321 | $200,482 | $76,440 | $124,042 |
| 2014 | -- | $190,930 | $72,800 | $118,130 |
| 2013 | -- | $181,549 | $70,000 | $111,549 |
Source: Public Records
Map
Nearby Homes
- 842 Woodbine Way
- 2496 Yew Street Rd
- 0 Princeton Ct
- 905 Queen St
- 0 Lopez St
- 143 S 44th St
- 2284 Yew Street Rd Unit B6
- 2284 Yew Street Rd Unit D3
- 1146 Whidbey St
- 1101 Whidbey St
- 115 43rd St
- 4224 Dumas Ave
- 1401 Edwards St
- 2501 Fireweed Ln
- 1125 Divine Ln
- 1110 Divine Ln
- 4007 Adams Ave
- 1211 Kenoyer Dr
- 1227 Puget St
- 1200 Lincoln St Unit 196
- 852 St Andrews Way
- 860 St Andrews Way
- 859 Woodbine Way
- 865 Woodbine Way
- 853 Woodbine Way
- 859 St Andrews Way
- 848 St Andrews Way
- 894 St Andrews Way
- 847 Woodbine Way
- 898 St Andrews Way
- 863 St Andrews Way
- 844 St Andrews Way
- 855 St Andrews Way
- 854 Woodbine Way
- 837 St Andrews Way
- 864 Woodbine Way
- 845 Woodbine Way
- 867 St Andrews Way
- 848 Woodbine Way
- 843 St Andrews Way