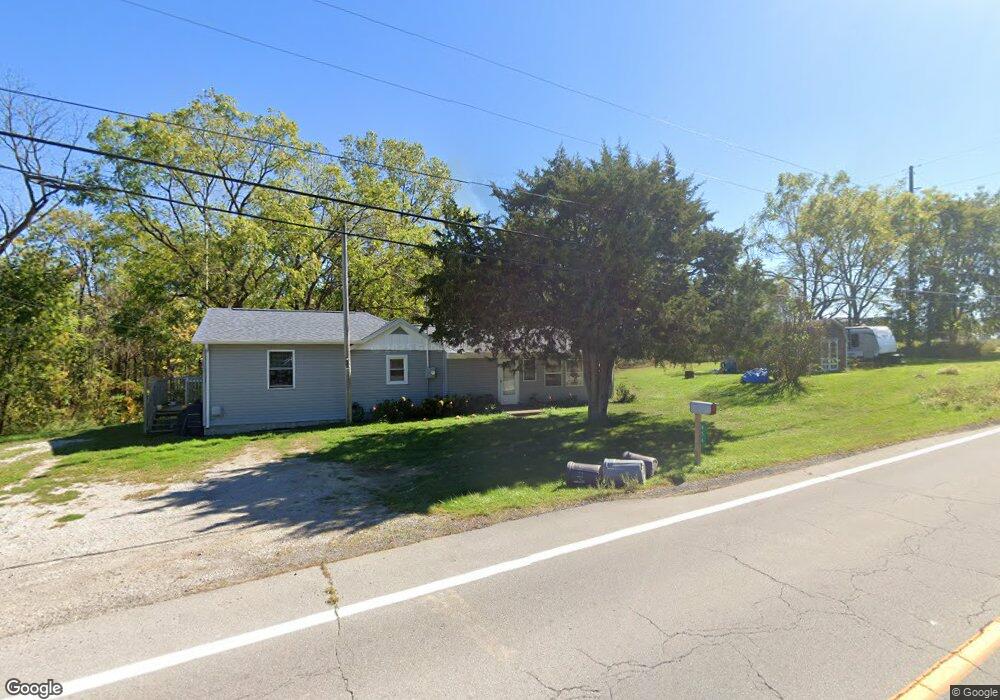
856 State Route 60 S New London, OH 44851
Estimated Value: $148,620 - $213,000
3
Beds
1
Bath
1,272
Sq Ft
$138/Sq Ft
Est. Value
About This Home
This home is located at 856 State Route 60 S, New London, OH 44851 and is currently estimated at $176,155, approximately $138 per square foot. 856 State Route 60 S is a home located in Huron County with nearby schools including New London Elementary School, New London Middle School, and New London High School.
Ownership History
Date
Name
Owned For
Owner Type
Purchase Details
Closed on
Jul 2, 2021
Sold by
Elkin Roy
Bought by
Burnsley Michael A and Burnsley Rita Jean
Current Estimated Value
Home Financials for this Owner
Home Financials are based on the most recent Mortgage that was taken out on this home.
Original Mortgage
$87,920
Interest Rate
2.9%
Mortgage Type
New Conventional
Purchase Details
Closed on
Mar 23, 2020
Sold by
County Of Huron
Bought by
Elkins Roy
Purchase Details
Closed on
Jan 12, 1999
Sold by
Balogh Susan M
Bought by
Elkin Roy L Rose M and Elkin Rose M
Purchase Details
Closed on
Nov 7, 1996
Sold by
Griffin Helen
Bought by
Balogh Susan M
Purchase Details
Closed on
May 17, 1996
Sold by
Hill Scott W
Bought by
Griffin Helen
Purchase Details
Closed on
Aug 4, 1993
Bought by
Hill Scott W and Bobbie Jo
Create a Home Valuation Report for This Property
The Home Valuation Report is an in-depth analysis detailing your home's value as well as a comparison with similar homes in the area
Home Values in the Area
Average Home Value in this Area
Purchase History
| Date | Buyer | Sale Price | Title Company |
|---|---|---|---|
| Burnsley Michael A | $109,900 | Miller Home Title | |
| Elkins Roy | $40,000 | None Available | |
| Elkin Roy L Rose M | $48,000 | -- | |
| Balogh Susan M | $44,500 | -- | |
| Griffin Helen | $27,500 | -- | |
| Hill Scott W | $26,900 | -- |
Source: Public Records
Mortgage History
| Date | Status | Borrower | Loan Amount |
|---|---|---|---|
| Previous Owner | Burnsley Michael A | $87,920 |
Source: Public Records
Tax History Compared to Growth
Tax History
| Year | Tax Paid | Tax Assessment Tax Assessment Total Assessment is a certain percentage of the fair market value that is determined by local assessors to be the total taxable value of land and additions on the property. | Land | Improvement |
|---|---|---|---|---|
| 2024 | $1,378 | $37,470 | $8,750 | $28,720 |
| 2023 | $1,378 | $25,560 | $6,510 | $19,050 |
| 2022 | $1,126 | $25,560 | $6,510 | $19,050 |
| 2021 | $573 | $16,330 | $6,510 | $9,820 |
| 2020 | $637 | $16,570 | $6,510 | $10,060 |
| 2019 | $634 | $16,570 | $6,510 | $10,060 |
| 2018 | $620 | $16,570 | $6,510 | $10,060 |
| 2017 | $498 | $14,320 | $6,510 | $7,810 |
| 2016 | $186 | $14,320 | $6,510 | $7,810 |
| 2015 | $185 | $14,330 | $6,510 | $7,820 |
| 2014 | $153 | $13,270 | $5,570 | $7,700 |
| 2013 | $152 | $13,270 | $5,570 | $7,700 |
Source: Public Records
Map
Nearby Homes
- 21 Cedar St
- 152 N Main St Unit 2
- 41 N Railroad St
- 179 W Main St
- 115 W Main St
- 41 Walnut St
- 0 Section Line Rd Unit 20253852
- 155 E Main St
- 159 E Main St
- 34 Park Ave
- 201 E Main St
- 99 S Main St
- 109 Clifton St
- 128 1st St
- 113 3rd St
- 3769 Prospect Rd
- 816 Butler Rd S
- 1345 County Road 16
- 37 State Route 60
- 3969 Town Line Road 187
- 856 Ohio 60
- 4911 Fayette Rd
- 983 Ohio 60
- 981 State Route 60 S
- 5086 Fayette Rd
- 1056 Ohio 60
- 1056 State Route 60 S
- 4687 Fayette Rd
- 581 Ohio 60
- 581 State Route 60 S
- 5235 Fayette Rd
- 540 State Route 60 S
- 5275 Fayette Rd
- 4581 Fayette Rd
- 4720 New London Section Line
- 440 State Route 60 S
- 1249 State Route 60 S
- 1249 Ohio 60
- 1240 State Route 60 S
- 966 State Route 60 S