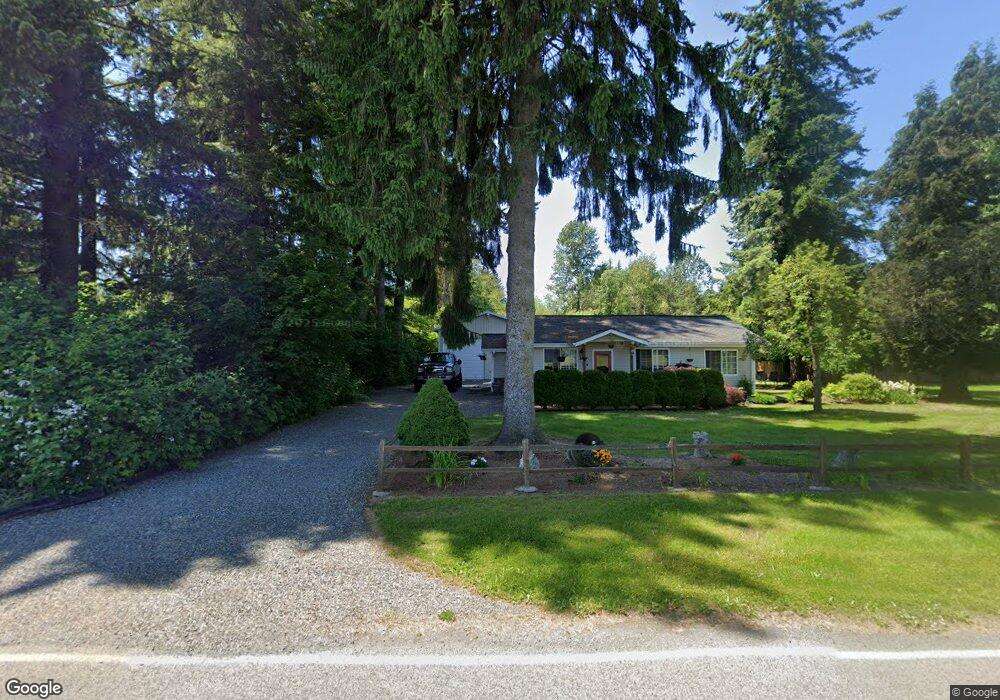
8561 Stein Rd Custer, WA 98240
Estimated Value: $513,000 - $553,000
3
Beds
1
Bath
1,012
Sq Ft
$524/Sq Ft
Est. Value
About This Home
This home is located at 8561 Stein Rd, Custer, WA 98240 and is currently estimated at $530,407, approximately $524 per square foot. 8561 Stein Rd is a home located in Whatcom County with nearby schools including Custer Elementary School, Horizon Middle School, and Ferndale High School.
Ownership History
Date
Name
Owned For
Owner Type
Purchase Details
Closed on
Jun 12, 2004
Sold by
Earle Daniel and Earle Khrystye
Bought by
Downing Dave P
Current Estimated Value
Home Financials for this Owner
Home Financials are based on the most recent Mortgage that was taken out on this home.
Original Mortgage
$132,000
Outstanding Balance
$63,500
Interest Rate
6.09%
Mortgage Type
Purchase Money Mortgage
Estimated Equity
$466,907
Purchase Details
Closed on
Mar 14, 2001
Sold by
Mehler Mike and Mehler Pamela
Bought by
Earle Daniel and Earle Khrystye
Home Financials for this Owner
Home Financials are based on the most recent Mortgage that was taken out on this home.
Original Mortgage
$102,036
Interest Rate
6.97%
Purchase Details
Closed on
Apr 10, 2000
Sold by
Parish Lucy L and Fuentes Paula Z
Bought by
Mehler Mike and Mehler Pamela
Home Financials for this Owner
Home Financials are based on the most recent Mortgage that was taken out on this home.
Original Mortgage
$20,000
Interest Rate
8.26%
Mortgage Type
Seller Take Back
Create a Home Valuation Report for This Property
The Home Valuation Report is an in-depth analysis detailing your home's value as well as a comparison with similar homes in the area
Purchase History
| Date | Buyer | Sale Price | Title Company |
|---|---|---|---|
| Downing Dave P | $165,000 | Stewart Title Company | |
| Earle Daniel | -- | Charter Title Corporation | |
| Mehler Mike | -- | First American Title Ins |
Source: Public Records
Mortgage History
| Date | Status | Borrower | Loan Amount |
|---|---|---|---|
| Open | Downing Dave P | $132,000 | |
| Previous Owner | Earle Daniel | $102,036 | |
| Previous Owner | Mehler Mike | $20,000 | |
| Closed | Downing Dave P | $24,750 |
Source: Public Records
Tax History
| Year | Tax Paid | Tax Assessment Tax Assessment Total Assessment is a certain percentage of the fair market value that is determined by local assessors to be the total taxable value of land and additions on the property. | Land | Improvement |
|---|---|---|---|---|
| 2025 | $3,373 | $434,514 | $290,030 | $144,484 |
| 2024 | $3,311 | $434,514 | $290,030 | $144,484 |
| 2023 | $3,311 | $463,927 | $325,000 | $138,927 |
| 2022 | $2,223 | $303,733 | $156,544 | $147,189 |
| 2021 | $2,071 | $241,055 | $124,240 | $116,815 |
| 2020 | $2,124 | $204,285 | $105,289 | $98,996 |
| 2019 | $1,705 | $189,150 | $97,488 | $91,662 |
| 2018 | $2,005 | $172,293 | $88,800 | $83,493 |
| 2017 | $1,751 | $155,219 | $80,000 | $75,219 |
| 2016 | $1,745 | $142,860 | $73,570 | $69,290 |
| 2015 | $1,688 | $142,860 | $73,570 | $69,290 |
| 2014 | -- | $134,365 | $69,195 | $65,170 |
| 2013 | -- | $131,510 | $67,725 | $63,785 |
Source: Public Records
Map
Nearby Homes
- 8741 Delta Line Rd
- 8085 Audra Ln
- 2962 Haynie Rd
- 3151 Velvet Ln
- 8731 Valley View Rd
- 3179 Velvet Ln
- 9067 Sunrise Rd
- 3269 Haynie Rd
- 0 Portal Way
- 0 Sunrise Rd Unit NWM2483531
- 0 Sunrise Rd Unit NWM2483639
- 0 Willeys Lake Rd Unit NWM2442375
- 2948 Arnie Rd
- 2176 Burk Rd
- 8306 Portal Way
- 8894 Giles Rd
- 9524 Freedom Place
- 2046 Burk Rd
- 0 Loomis Trail Rd
- 2031 Camber Ln
Your Personal Tour Guide
Ask me questions while you tour the home.