Estimated Value: $530,000 - $601,000
2
Beds
1
Bath
1,390
Sq Ft
$407/Sq Ft
Est. Value
About This Home
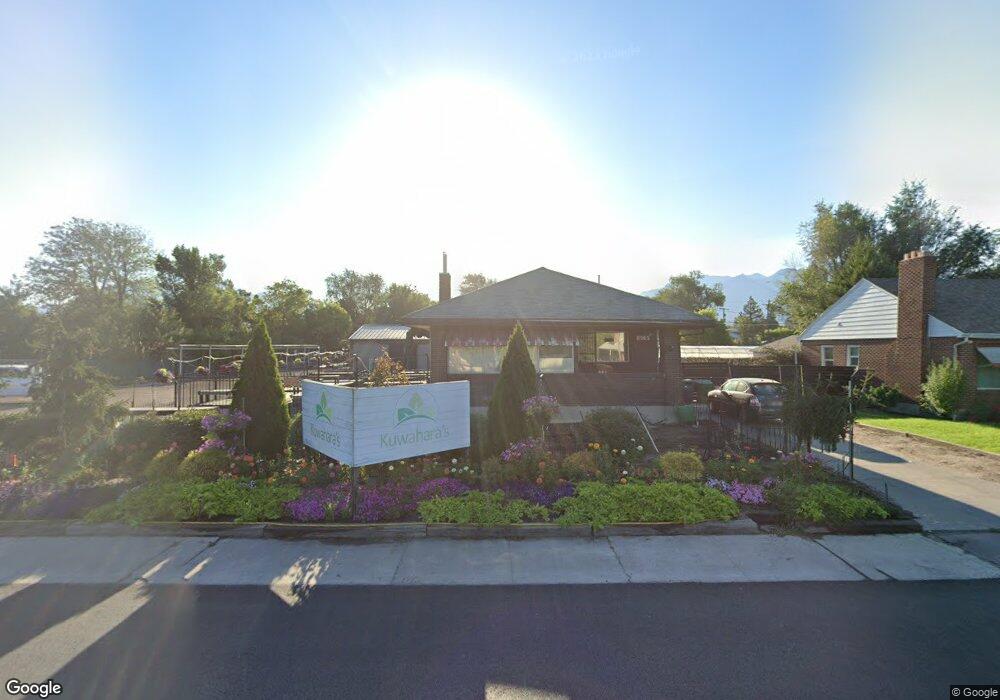
This home is located at 8565 S State St, Sandy, UT 84070 and is currently estimated at $565,500, approximately $406 per square foot. 8565 S State St is a home located in Salt Lake County with nearby schools including Sandy Elementary School, Mount Jordan Middle School, and Jordan High.
Ownership History
Date
Name
Owned For
Owner Type
Purchase Details
Closed on
May 24, 2023
Sold by
Rea Carole Ann
Bought by
Rea Carole Ann and Kuwahara Alex Jordan
Current Estimated Value
Home Financials for this Owner
Home Financials are based on the most recent Mortgage that was taken out on this home.
Original Mortgage
$200,000
Outstanding Balance
$194,316
Interest Rate
6.27%
Mortgage Type
New Conventional
Estimated Equity
$371,184
Purchase Details
Closed on
May 3, 2017
Sold by
Rea Carole Ann
Bought by
Rae Carole Ann and Kuwahara Alex
Purchase Details
Closed on
Sep 28, 2006
Sold by
Conish Mark G and Conish Alice R
Bought by
Rea Carole Ann
Purchase Details
Closed on
Sep 25, 2006
Sold by
Conish Mark G and Conish Alice R
Bought by
Rea Carole Ann
Purchase Details
Closed on
Aug 18, 2006
Sold by
Conish Mark George and Johnson Alice Renae
Bought by
Rea Carole Ann
Create a Home Valuation Report for This Property
The Home Valuation Report is an in-depth analysis detailing your home's value as well as a comparison with similar homes in the area
Home Values in the Area
Average Home Value in this Area
Purchase History
| Date | Buyer | Sale Price | Title Company |
|---|---|---|---|
| Rea Carole Ann | -- | Old Republic Title | |
| Rae Carole Ann | -- | Mountain View Title & Escrow | |
| Rea Carole Ann | -- | None Available | |
| Rea Carole Ann | -- | None Available | |
| Rea Carole Ann | -- | None Available |
Source: Public Records
Mortgage History
| Date | Status | Borrower | Loan Amount |
|---|---|---|---|
| Open | Rea Carole Ann | $200,000 | |
| Closed | Rae Carole Ann | $0 |
Source: Public Records
Tax History
| Year | Tax Paid | Tax Assessment Tax Assessment Total Assessment is a certain percentage of the fair market value that is determined by local assessors to be the total taxable value of land and additions on the property. | Land | Improvement |
|---|---|---|---|---|
| 2025 | $4,985 | $768,890 | $761,200 | $7,690 |
| 2024 | $4,985 | $825,890 | $703,400 | $122,490 |
| 2023 | $4,735 | $781,690 | $664,900 | $116,790 |
| 2022 | $4,271 | $685,590 | $578,100 | $107,490 |
| 2021 | $7,162 | $645,400 | $549,200 | $96,200 |
| 2020 | $6,929 | $588,300 | $491,400 | $96,900 |
| 2019 | $4,618 | $583,290 | $490,900 | $92,390 |
| 2016 | $2,206 | $298,890 | $288,800 | $10,090 |
Source: Public Records
Map
Nearby Homes
- 87 Pioneer Ave
- 8470 Solar Way
- 112 E 8680 S
- 149 E Pioneer Ave
- 87 W 8710 S
- 140 Paula Dr
- 8558 S Center St
- 194 Pioneer Ave
- 220 E Pioneer Ave
- 140 W 8710 S
- 36 E Opequon Rd
- 227 E St Germain Way
- 132 E Chambord Ct
- 136 E Chambord Ct
- 138 E Chambord Ct
- 140 E Chambord Ct
- 144 E Chambord Ct
- 8343 Monroe St
- 36 Marquette Dr
- 117 E Calbourne Ln Unit I4
- 8575 S State St
- 8585 State St
- 8585 S State St
- 8523 State St
- 8587 S State St
- 18 E Pioneer Ave
- 28 E Pioneer Ave
- 28 Pioneer Ave
- 8572 S State St
- 8603 S State St
- 8619 S State St
- 8538 S State St
- 8585 S 40 E
- 42 E Pioneer Ave
- 36 Pioneer Ave
- 8631 S State St
- 21 E 8640 S
- 31 Pioneer Ave
- 42 Pioneer Ave
- 33 E 8640 S
Your Personal Tour Guide
Ask me questions while you tour the home.