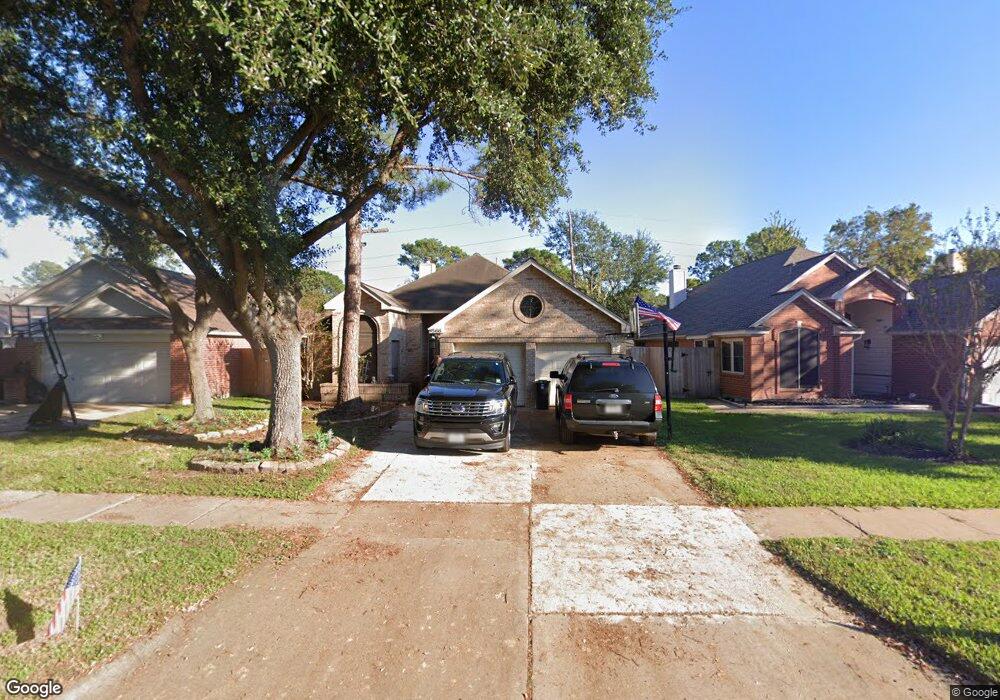
8566 Spring Green Dr Houston, TX 77095
Copperfield NeighborhoodEstimated Value: $248,667 - $282,000
3
Beds
2
Baths
1,666
Sq Ft
$161/Sq Ft
Est. Value
About This Home
This home is located at 8566 Spring Green Dr, Houston, TX 77095 and is currently estimated at $267,667, approximately $160 per square foot. 8566 Spring Green Dr is a home located in Harris County with nearby schools including Fiest Elementary School, Labay Middle School, and Cypress Falls High School.
Ownership History
Date
Name
Owned For
Owner Type
Purchase Details
Closed on
Mar 12, 2021
Sold by
Hall Mark K and Hall Tuyen T
Bought by
So Mot Holdings Llc
Current Estimated Value
Purchase Details
Closed on
Sep 9, 2013
Sold by
Vincent Loyd and Vincent Joseph L
Bought by
Hall Mark K
Home Financials for this Owner
Home Financials are based on the most recent Mortgage that was taken out on this home.
Original Mortgage
$102,000
Interest Rate
4.36%
Mortgage Type
New Conventional
Purchase Details
Closed on
Aug 10, 2012
Sold by
Muller Diana K
Bought by
Vincent Mary and Vincent Lloyd
Purchase Details
Closed on
Aug 2, 2006
Sold by
Dady Curtis L and Dady Elaine M
Bought by
Muller Diana K
Home Financials for this Owner
Home Financials are based on the most recent Mortgage that was taken out on this home.
Original Mortgage
$92,000
Interest Rate
6.66%
Mortgage Type
Purchase Money Mortgage
Create a Home Valuation Report for This Property
The Home Valuation Report is an in-depth analysis detailing your home's value as well as a comparison with similar homes in the area
Home Values in the Area
Average Home Value in this Area
Purchase History
| Date | Buyer | Sale Price | Title Company |
|---|---|---|---|
| So Mot Holdings Llc | -- | None Listed On Document | |
| Hall Mark K | -- | None Available | |
| Vincent Mary | -- | Stewart Title Huston Divisio | |
| Muller Diana K | -- | Startex Title Company |
Source: Public Records
Mortgage History
| Date | Status | Borrower | Loan Amount |
|---|---|---|---|
| Previous Owner | Hall Mark K | $102,000 | |
| Previous Owner | Muller Diana K | $92,000 |
Source: Public Records
Tax History Compared to Growth
Tax History
| Year | Tax Paid | Tax Assessment Tax Assessment Total Assessment is a certain percentage of the fair market value that is determined by local assessors to be the total taxable value of land and additions on the property. | Land | Improvement |
|---|---|---|---|---|
| 2025 | $5,106 | $267,769 | $56,801 | $210,968 |
| 2024 | $5,106 | $250,309 | $47,446 | $202,863 |
| 2023 | $5,106 | $251,667 | $47,446 | $204,221 |
| 2022 | $5,451 | $246,700 | $33,858 | $212,842 |
| 2021 | $4,525 | $194,897 | $33,858 | $161,039 |
| 2020 | $4,463 | $187,142 | $28,289 | $158,853 |
| 2019 | $4,196 | $170,000 | $28,289 | $141,711 |
| 2018 | $2,160 | $150,000 | $28,289 | $121,711 |
| 2017 | $3,441 | $150,000 | $28,289 | $121,711 |
| 2016 | $3,441 | $150,000 | $28,289 | $121,711 |
| 2015 | $3,064 | $150,000 | $28,289 | $121,711 |
| 2014 | $3,064 | $127,500 | $21,830 | $105,670 |
Source: Public Records
Map
Nearby Homes
- 8550 Sparkling Springs Dr
- 15954 Oak Mountain Dr
- 8306 Lake Crystal Dr
- 8426 Laurel Trails Dr
- 8526 Hot Springs Dr
- 8550 Waiting Spring Ln
- 16111 Aberdeen Forest Dr
- 16123 Aberdeen Forest Dr
- 8818 Apple Mill Dr
- 8814 Sherina Park Dr
- 8526 Greenleaf Lake Dr
- 15735 Jamie Lee Dr
- 15918 Pinyon Creek Dr
- 16211 Green Smoke Dr
- 16403 Torry View Terrace
- 16335 Drystone Ln
- 15906 Marwick Ct
- 15802 Aberdeen Trails Dr
- 16426 Torry View Terrace
- 8619 Arranmore Ln
- 8570 Spring Green Dr
- 8562 Spring Green Dr
- 8554 Spring Green Dr
- 8602 Spring Green Dr
- 15958 Oak Mountain Dr
- 15962 Oak Mountain Dr
- 8606 Spring Green Dr
- 8550 Spring Green Dr
- 15950 Oak Mountain Dr
- 15966 Oak Mountain Dr
- 8567 Spring Green Dr
- 8563 Spring Green Dr
- 8571 Spring Green Dr
- 8559 Spring Green Dr
- 15946 Oak Mountain Dr
- 8610 Spring Green Dr
- 8546 Spring Green Dr
- 15970 Oak Mountain Dr
- 8603 Spring Green Dr
- 8555 Spring Green Dr