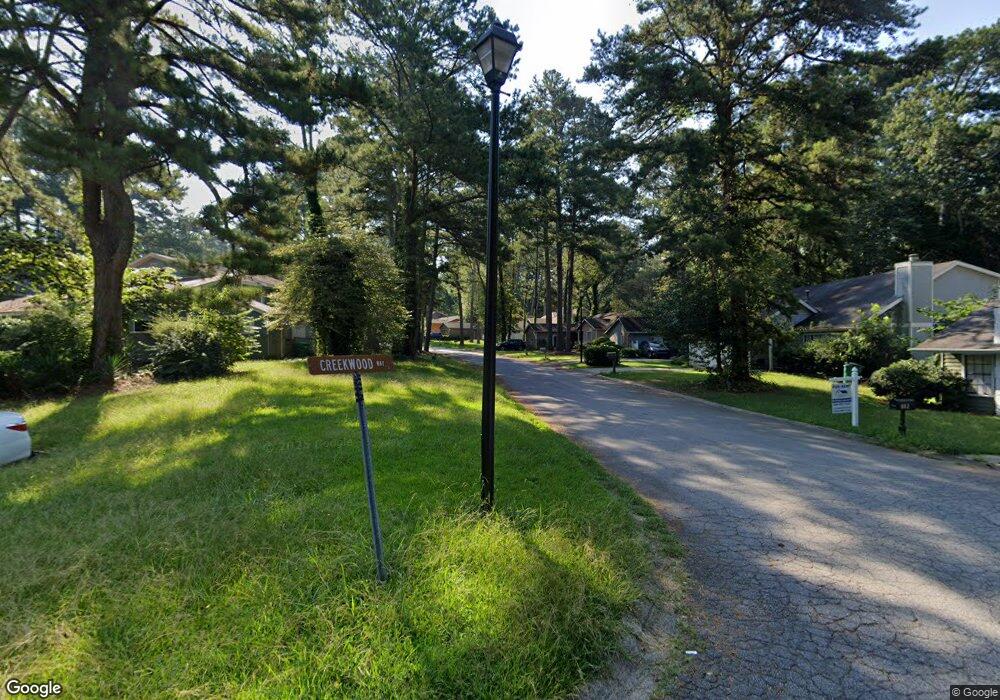
8569 Creekwood Way Jonesboro, GA 30238
Estimated Value: $95,911 - $126,000
3
Beds
2
Baths
1,392
Sq Ft
$77/Sq Ft
Est. Value
About This Home
This home is located at 8569 Creekwood Way, Jonesboro, GA 30238 and is currently estimated at $106,978, approximately $76 per square foot. 8569 Creekwood Way is a home located in Clayton County with nearby schools including Pointe South Elementary School, Pointe South Middle School, and Riverdale High School.
Ownership History
Date
Name
Owned For
Owner Type
Purchase Details
Closed on
Jan 12, 2022
Sold by
Landa Properties Llc
Bought by
Landa App Llc and 8569 Creekwood Way Jonesboro Ga Llc
Current Estimated Value
Home Financials for this Owner
Home Financials are based on the most recent Mortgage that was taken out on this home.
Original Mortgage
$49,400
Interest Rate
3.22%
Mortgage Type
Mortgage Modification
Purchase Details
Closed on
Aug 29, 2019
Sold by
2172 Stockbridge Llc
Bought by
Landa Properties Llc
Purchase Details
Closed on
May 31, 2017
Sold by
Ray Oliver J
Bought by
2172 Stockbridge Llc
Purchase Details
Closed on
May 14, 2003
Sold by
Oliver Jack R
Bought by
Oliver J Ray
Home Financials for this Owner
Home Financials are based on the most recent Mortgage that was taken out on this home.
Original Mortgage
$36,000
Interest Rate
5.81%
Create a Home Valuation Report for This Property
The Home Valuation Report is an in-depth analysis detailing your home's value as well as a comparison with similar homes in the area
Home Values in the Area
Average Home Value in this Area
Purchase History
| Date | Buyer | Sale Price | Title Company |
|---|---|---|---|
| Landa App Llc | -- | -- | |
| Landa Properties Llc | $128,678 | -- | |
| 2172 Stockbridge Llc | $38,000 | -- | |
| Oliver J Ray | $36,000 | -- | |
| Oliver Jack R | $35,268 | -- |
Source: Public Records
Mortgage History
| Date | Status | Borrower | Loan Amount |
|---|---|---|---|
| Previous Owner | Landa App Llc | $49,400 | |
| Previous Owner | Oliver Jack R | $36,000 |
Source: Public Records
Tax History Compared to Growth
Tax History
| Year | Tax Paid | Tax Assessment Tax Assessment Total Assessment is a certain percentage of the fair market value that is determined by local assessors to be the total taxable value of land and additions on the property. | Land | Improvement |
|---|---|---|---|---|
| 2024 | $1,573 | $40,320 | $2,000 | $38,320 |
| 2023 | $1,145 | $31,720 | $2,000 | $29,720 |
| 2022 | $849 | $21,640 | $2,000 | $19,640 |
| 2021 | $711 | $18,000 | $2,000 | $16,000 |
| 2020 | $691 | $17,272 | $2,000 | $15,272 |
| 2019 | $816 | $20,109 | $2,000 | $18,109 |
| 2018 | $617 | $15,200 | $2,000 | $13,200 |
| 2017 | $711 | $17,473 | $2,000 | $15,473 |
| 2016 | $700 | $17,208 | $2,000 | $15,208 |
| 2015 | $615 | $0 | $0 | $0 |
| 2014 | $507 | $12,759 | $2,000 | $10,759 |
Source: Public Records
Map
Nearby Homes
- 8602 Creekwood Way
- 8574 Creekwood Way
- 8588 Creekwood Way
- 841 Kenwood Ln
- 8685 Woodside Ln
- 781 Villa Way
- 1120 Brandon Hill Way
- 778 Villa Way
- 1089 Brandon Hill Way
- 1065 Brandon Hill Way
- 725 Oak Dr
- 8684 Lakeview Commons
- 8717 Lakeview Commons
- 638 Wellington Way
- 8614 Webb Rd
- 8624 Webb Rd
- 8626 Webb Rd
- 8632 Webb Rd
- 8638 Webb Rd
- 8640 Webb Rd
- 8581 Creekwood Way
- 8567 Creekwood Way
- 8577 Creekwood Way
- 8571 Creekwood Way
- 8573 Creekwood Way
- 8579 Creekwood Way
- 8575 Creekwood Way
- 8590 Creekwood Way
- 8598 Creekwood Way Unit 8598
- 8608 Creekwood Way
- 8600 Creekwood Way
- 8600 Creekside Way
- 0 Creekwood Way Unit 7491685
- 0 Creekwood Way Unit 7139173
- 0 Creekwood Way Unit 7591155
- 0 Creekwood Way Unit 7348829
- 0 Creekwood Way Unit 7219341
- 0 Creekwood Way Unit 8608482
- 0 Creekwood Way Unit 8181649
- 0 Creekwood Way Unit 7635329