Estimated Value: $278,892 - $313,000
3
Beds
2
Baths
1,300
Sq Ft
$224/Sq Ft
Est. Value
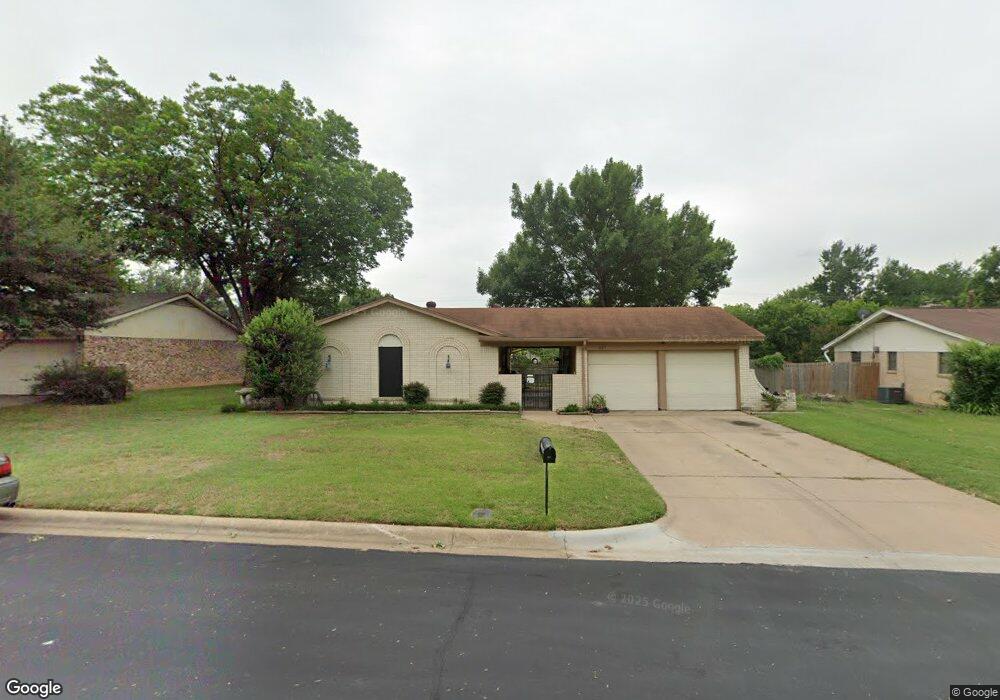
About This Home
This home is located at 857 Henson Dr, Hurst, TX 76053 and is currently estimated at $290,723, approximately $223 per square foot. 857 Henson Dr is a home located in Tarrant County with nearby schools including Hurst Hills Elementary School, Hurst J High School, and L.D. Bell High School.
Ownership History
Date
Name
Owned For
Owner Type
Purchase Details
Closed on
Oct 28, 2016
Sold by
Brown Sandra K and Aaron Sandra B
Bought by
Cigainero Katherine and Cigainero Aidan
Current Estimated Value
Home Financials for this Owner
Home Financials are based on the most recent Mortgage that was taken out on this home.
Original Mortgage
$126,663
Outstanding Balance
$105,002
Interest Rate
4.5%
Mortgage Type
FHA
Estimated Equity
$185,721
Purchase Details
Closed on
May 26, 1994
Sold by
Cisneros Henry G
Bought by
Brown Sandra K
Home Financials for this Owner
Home Financials are based on the most recent Mortgage that was taken out on this home.
Original Mortgage
$66,948
Interest Rate
8.19%
Mortgage Type
FHA
Purchase Details
Closed on
Jan 26, 1994
Sold by
Colonial Svgs Fa
Bought by
Hud
Purchase Details
Closed on
Jan 4, 1994
Sold by
Brookshire Lee J
Bought by
Colonial Svgs Fa
Create a Home Valuation Report for This Property
The Home Valuation Report is an in-depth analysis detailing your home's value as well as a comparison with similar homes in the area
Home Values in the Area
Average Home Value in this Area
Purchase History
| Date | Buyer | Sale Price | Title Company |
|---|---|---|---|
| Cigainero Katherine | -- | None Available | |
| Brown Sandra K | -- | -- | |
| Hud | -- | First American Title Co | |
| Colonial Svgs Fa | -- | First American Title Co |
Source: Public Records
Mortgage History
| Date | Status | Borrower | Loan Amount |
|---|---|---|---|
| Open | Cigainero Katherine | $126,663 | |
| Previous Owner | Brown Sandra K | $66,948 |
Source: Public Records
Tax History Compared to Growth
Tax History
| Year | Tax Paid | Tax Assessment Tax Assessment Total Assessment is a certain percentage of the fair market value that is determined by local assessors to be the total taxable value of land and additions on the property. | Land | Improvement |
|---|---|---|---|---|
| 2025 | $2,833 | $225,841 | $58,320 | $167,521 |
| 2024 | $2,833 | $225,841 | $58,320 | $167,521 |
| 2023 | $3,796 | $189,480 | $48,600 | $140,880 |
| 2022 | $4,059 | $176,310 | $48,600 | $127,710 |
| 2021 | $3,925 | $162,724 | $50,000 | $112,724 |
| 2020 | $4,044 | $168,071 | $50,000 | $118,071 |
| 2019 | $4,077 | $169,155 | $50,000 | $119,155 |
| 2018 | $3,149 | $151,423 | $25,000 | $126,423 |
| 2017 | $3,483 | $137,657 | $25,000 | $112,657 |
| 2016 | $3,146 | $124,312 | $25,000 | $99,312 |
| 2015 | $2,552 | $97,300 | $20,000 | $77,300 |
| 2014 | $2,552 | $97,300 | $20,000 | $77,300 |
Source: Public Records
Map
Nearby Homes
- 425 Moore Creek Rd
- 405 Billy Creek Cir
- 808 Betty Ct
- 512 Billie Ruth Ln
- 741 Ponderosa Dr
- 1112 Blakey Ct
- 1200 Walker Dr
- 758 Briarwood Ln
- 756 Briarwood Ln
- 425 Ridgecrest Dr
- 637 Post Oak Dr
- 649 Timberline Dr
- 632 Melbourne Ct
- 3216 Fountain Pkwy
- 744 Briarwood Ln
- 228 Arcadia St
- 1304 W Redbud Dr
- 628 Elm St
- 520 W Redbud Dr
- 8308 Fall Crest Dr
- 853 Henson Dr
- 901 Henson Dr
- 849 Henson Dr
- 905 Henson Dr
- 860 Magnolia Ct
- 400 Englewood Ln
- 856 Magnolia Ct
- 401 Englewood Ln
- 845 Henson Dr
- 855 Magnolia Ct
- 852 Magnolia Ct
- 401 Apple Blossom Ln
- 404 Englewood Ln
- 909 Henson Dr
- 405 Englewood Ln
- 841 Henson Dr
- 405 Apple Blossom Ln
- 848 Magnolia Ct
- 408 Englewood Ln
- 409 Englewood Ln