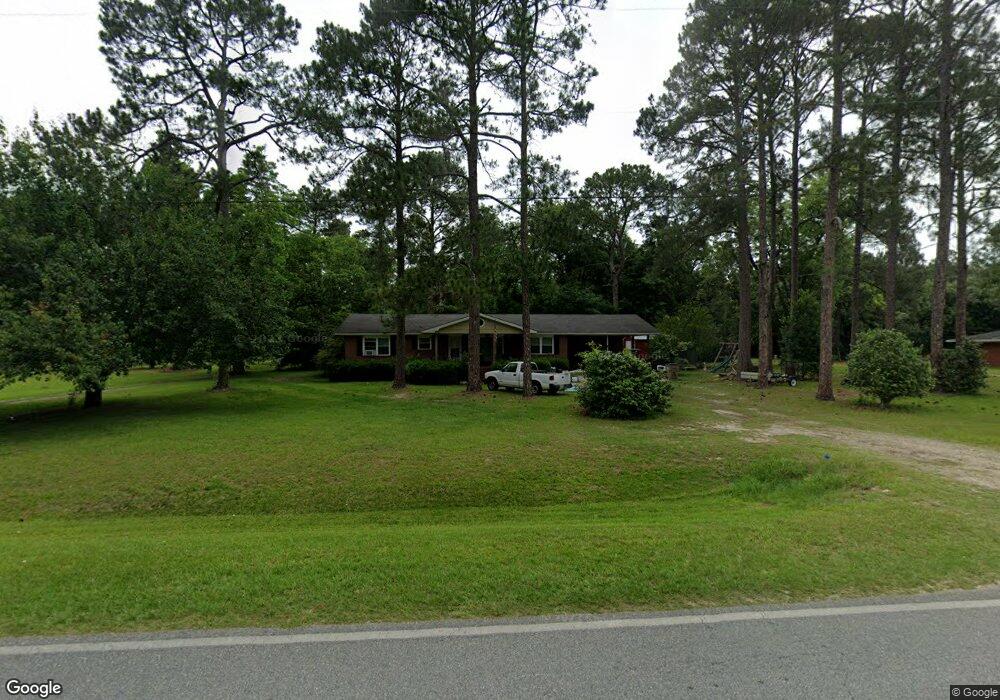
857 Lower Brookfield Rd Tifton, GA 31794
Estimated Value: $174,438 - $230,000
3
Beds
2
Baths
1,560
Sq Ft
$132/Sq Ft
Est. Value
About This Home
This home is located at 857 Lower Brookfield Rd, Tifton, GA 31794 and is currently estimated at $205,860, approximately $131 per square foot. 857 Lower Brookfield Rd is a home located in Tift County with nearby schools including Matt Wilson Elementary School, J.T. Reddick School, and Annie Belle Clark Primary School.
Ownership History
Date
Name
Owned For
Owner Type
Purchase Details
Closed on
Dec 20, 2013
Sold by
Scarbrough David E
Bought by
Johnson Timothy
Current Estimated Value
Home Financials for this Owner
Home Financials are based on the most recent Mortgage that was taken out on this home.
Original Mortgage
$111,224
Outstanding Balance
$83,263
Interest Rate
4.25%
Mortgage Type
New Conventional
Estimated Equity
$122,597
Purchase Details
Closed on
Feb 13, 2013
Sold by
Cameron Carey M
Bought by
Scarbrough David E and Scarbrough Melba J
Home Financials for this Owner
Home Financials are based on the most recent Mortgage that was taken out on this home.
Original Mortgage
$39,390
Interest Rate
3.4%
Mortgage Type
New Conventional
Purchase Details
Closed on
Dec 30, 1974
Sold by
Maton Margaret Ann Jackson
Bought by
Jackson Isaac E Aka Ike
Purchase Details
Closed on
Mar 18, 1965
Sold by
Jackson Ike
Bought by
Jackson Joel D
Create a Home Valuation Report for This Property
The Home Valuation Report is an in-depth analysis detailing your home's value as well as a comparison with similar homes in the area
Home Values in the Area
Average Home Value in this Area
Purchase History
| Date | Buyer | Sale Price | Title Company |
|---|---|---|---|
| Johnson Timothy | $109,000 | -- | |
| Scarbrough David E | $45,000 | -- | |
| Jackson Isaac E Aka Ike | -- | -- | |
| Jackson Joel D | -- | -- |
Source: Public Records
Mortgage History
| Date | Status | Borrower | Loan Amount |
|---|---|---|---|
| Open | Johnson Timothy | $111,224 | |
| Previous Owner | Scarbrough David E | $39,390 |
Source: Public Records
Tax History Compared to Growth
Tax History
| Year | Tax Paid | Tax Assessment Tax Assessment Total Assessment is a certain percentage of the fair market value that is determined by local assessors to be the total taxable value of land and additions on the property. | Land | Improvement |
|---|---|---|---|---|
| 2024 | $1,384 | $65,423 | $1,676 | $63,747 |
| 2023 | $1,504 | $33,277 | $1,200 | $32,077 |
| 2022 | $928 | $33,277 | $1,200 | $32,077 |
| 2021 | $934 | $33,277 | $1,200 | $32,077 |
| 2020 | $952 | $33,277 | $1,200 | $32,077 |
| 2019 | $950 | $33,277 | $1,200 | $32,077 |
| 2018 | $948 | $33,277 | $1,200 | $32,077 |
| 2017 | $953 | $33,277 | $1,200 | $32,077 |
| 2016 | $954 | $33,277 | $1,200 | $32,077 |
| 2015 | $954 | $33,277 | $1,200 | $32,077 |
| 2014 | $799 | $26,136 | $1,200 | $24,936 |
| 2013 | -- | $26,136 | $1,200 | $24,936 |
Source: Public Records
Map
Nearby Homes
- 21 Brookfield-Lenox Rd
- 3365 Chula Brookfield Rd
- 58 Honeysuckle Ln
- 204 Brookfield Nashville Rd
- 2066 U S 82
- 0 Baker Rd
- 5 Paradise Lake Rd
- 39 Paradise Lake Rd
- 287 Brookfield Nashville Rd
- 720 Vanceville County Line Rd
- 2635 Brookfield-Lenox Rd
- Tract 4 Harold Tyson Rd
- Tract 5 Harold Tyson Rd
- 69 Branch Ln
- Tract 5 Jehu Tyson Rd
- Tract 6 Jehu Tyson Rd
- Tract 2 Harold Tyson Rd
- Tract 3 Harold Tyson Rd
- 350 Copeland Rd
- 0 E 0 Hwy 125 S
- 863 Lower Brookfield Rd
- 853 Lower Brookfield Rd
- 862 Lower Brookfield Rd
- 845 Lower Brookfield Rd
- 852 Lower Brookfield Rd
- 831 Lower Brookfield Rd
- 883 Lower Brookfield Rd
- 884 Lower Brookfield Rd
- 11 Hayes Cir
- 894 Lower Brookfield Rd
- 19 Hayes Cir
- 25 Hayes Cir
- 20 Smith Ct
- 24 Smith Ct
- 30 Smith Ct
- 902 Lower Brookfield Rd
- 15 Smith Ct
- 31 Fredrick Dr
- 21 Smith Ct
- 25 Smith Ct