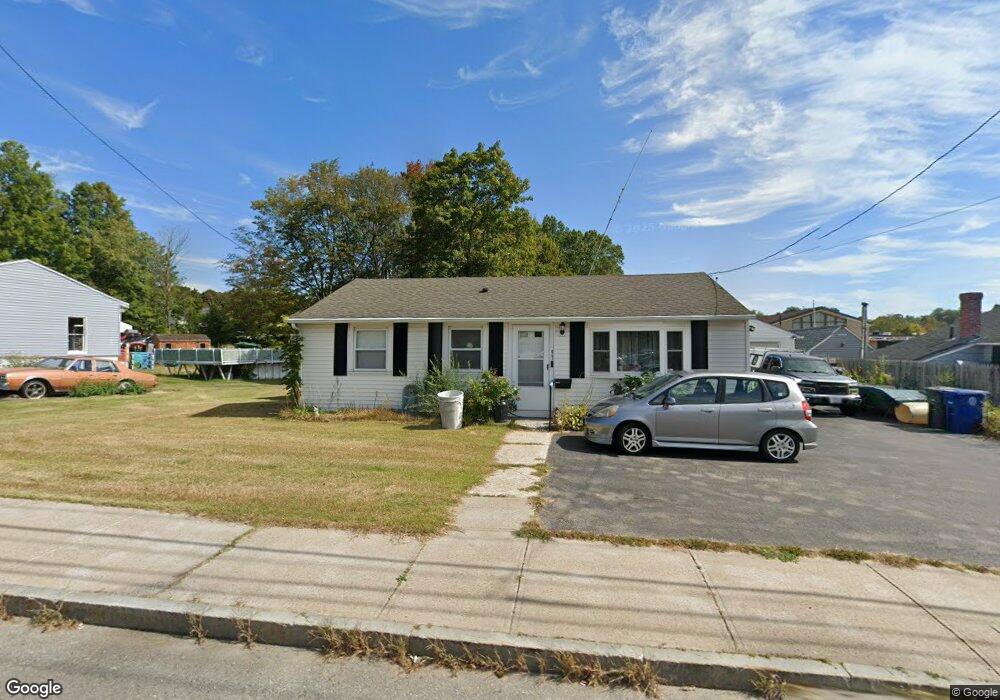
857 Main St Leominster, MA 01453
Estimated Value: $332,000 - $380,000
3
Beds
1
Bath
864
Sq Ft
$412/Sq Ft
Est. Value
About This Home
This home is located at 857 Main St, Leominster, MA 01453 and is currently estimated at $355,733, approximately $411 per square foot. 857 Main St is a home located in Worcester County with nearby schools including Leominster High School, St. Leo School, and St Bernards Elementary School.
Ownership History
Date
Name
Owned For
Owner Type
Purchase Details
Closed on
May 19, 1992
Sold by
Hudson Sb
Bought by
Sargent Edward and Sargent Rachel
Current Estimated Value
Home Financials for this Owner
Home Financials are based on the most recent Mortgage that was taken out on this home.
Original Mortgage
$80,750
Interest Rate
8.89%
Mortgage Type
Purchase Money Mortgage
Purchase Details
Closed on
Dec 5, 1991
Sold by
Hesson Loretta
Bought by
Hudson Sb
Create a Home Valuation Report for This Property
The Home Valuation Report is an in-depth analysis detailing your home's value as well as a comparison with similar homes in the area
Home Values in the Area
Average Home Value in this Area
Purchase History
| Date | Buyer | Sale Price | Title Company |
|---|---|---|---|
| Sargent Edward | $79,000 | -- | |
| Hudson Sb | $65,000 | -- |
Source: Public Records
Mortgage History
| Date | Status | Borrower | Loan Amount |
|---|---|---|---|
| Open | Hudson Sb | $20,000 | |
| Open | Hudson Sb | $73,300 | |
| Closed | Hudson Sb | $80,750 |
Source: Public Records
Tax History Compared to Growth
Tax History
| Year | Tax Paid | Tax Assessment Tax Assessment Total Assessment is a certain percentage of the fair market value that is determined by local assessors to be the total taxable value of land and additions on the property. | Land | Improvement |
|---|---|---|---|---|
| 2025 | $4,327 | $308,400 | $113,300 | $195,100 |
| 2024 | $4,231 | $291,600 | $107,900 | $183,700 |
| 2023 | $4,092 | $263,300 | $93,800 | $169,500 |
| 2022 | $3,923 | $236,900 | $81,600 | $155,300 |
| 2021 | $3,483 | $192,100 | $63,500 | $128,600 |
| 2020 | $3,278 | $182,300 | $63,500 | $118,800 |
| 2019 | $3,143 | $169,500 | $60,500 | $109,000 |
| 2018 | $3,075 | $159,100 | $58,700 | $100,400 |
| 2017 | $2,890 | $146,500 | $54,800 | $91,700 |
| 2016 | $2,784 | $142,200 | $54,800 | $87,400 |
| 2015 | $2,659 | $136,800 | $54,800 | $82,000 |
| 2014 | $2,439 | $129,100 | $59,300 | $69,800 |
Source: Public Records
Map
Nearby Homes
- 17 Fernwood Dr Unit D
- 17 Fernwood Dr Unit G
- 51 Fox Meadow Rd Unit C
- 14 Fernwood Dr Unit D
- 291 Joslin St
- 51 Claflin St
- 67 Bernice Ave
- 1084 Main St
- 40 Flaggler Rd
- 633 Main St
- 75 Dale Ave
- 11 Dale Ave
- 593 Main St Unit SL4
- 14 Stetson St
- 66 Hamilton St Unit 3
- 57 Liberty St Unit 2
- 89 Benjamin St
- 121 Morningside St Unit 121
- 104 Harrison St
- 12 Lindell Ave