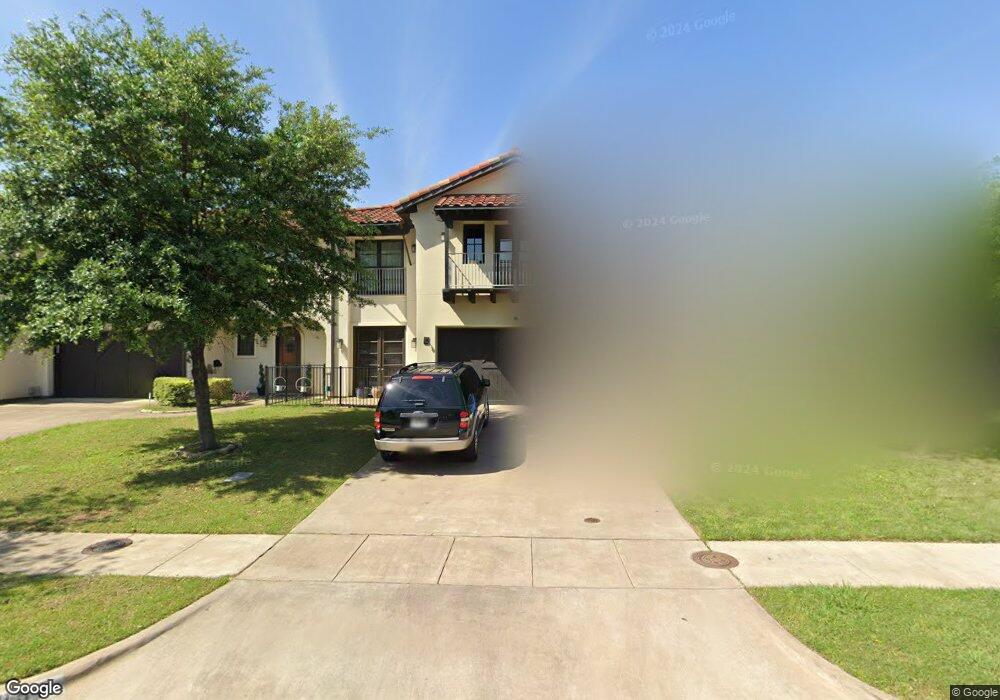
857 N Glasgow Dr Unit A Dallas, TX 75214
Old East Dallas NeighborhoodEstimated Value: $590,926 - $833,000
3
Beds
3
Baths
2,393
Sq Ft
$280/Sq Ft
Est. Value
About This Home
This home is located at 857 N Glasgow Dr Unit A, Dallas, TX 75214 and is currently estimated at $670,732, approximately $280 per square foot. 857 N Glasgow Dr Unit A is a home located in Dallas County with nearby schools including William Lipscomb Elementary School, J L Long Middle School, and Woodrow Wilson High School.
Ownership History
Date
Name
Owned For
Owner Type
Purchase Details
Closed on
Jul 9, 2025
Sold by
Cotner Kyle and Cotner Mary Kelly
Bought by
Chen Debbe and Chen John
Current Estimated Value
Purchase Details
Closed on
Nov 5, 2019
Sold by
Spiegel David and Hirsch Samantha
Bought by
Simmons Zachary and Simmons Sarah
Home Financials for this Owner
Home Financials are based on the most recent Mortgage that was taken out on this home.
Original Mortgage
$420,000
Interest Rate
3.6%
Mortgage Type
New Conventional
Purchase Details
Closed on
Feb 7, 2017
Sold by
Mansour Marc I and Khoury Chaouki K
Bought by
Spiegel David and Hirsch Samantha
Home Financials for this Owner
Home Financials are based on the most recent Mortgage that was taken out on this home.
Original Mortgage
$365,000
Interest Rate
4.32%
Create a Home Valuation Report for This Property
The Home Valuation Report is an in-depth analysis detailing your home's value as well as a comparison with similar homes in the area
Home Values in the Area
Average Home Value in this Area
Purchase History
| Date | Buyer | Sale Price | Title Company |
|---|---|---|---|
| Chen Debbe | -- | None Listed On Document | |
| Simmons Zachary | -- | Capital Title | |
| Spiegel David | -- | None Available |
Source: Public Records
Mortgage History
| Date | Status | Borrower | Loan Amount |
|---|---|---|---|
| Previous Owner | Simmons Zachary | $420,000 | |
| Previous Owner | Spiegel David | $365,000 |
Source: Public Records
Tax History Compared to Growth
Tax History
| Year | Tax Paid | Tax Assessment Tax Assessment Total Assessment is a certain percentage of the fair market value that is determined by local assessors to be the total taxable value of land and additions on the property. | Land | Improvement |
|---|---|---|---|---|
| 2025 | $8,791 | $518,500 | $111,500 | $407,000 |
| 2024 | $8,791 | $518,500 | $111,500 | $407,000 |
| 2023 | $8,791 | $518,500 | $89,200 | $429,300 |
| 2022 | $12,964 | $518,500 | $89,200 | $429,300 |
| 2021 | $12,156 | $460,800 | $89,200 | $371,600 |
| 2020 | $12,501 | $460,800 | $89,200 | $371,600 |
| 2019 | $13,111 | $460,800 | $89,200 | $371,600 |
| 2018 | $12,530 | $460,800 | $55,750 | $405,050 |
| 2017 | $11,716 | $430,850 | $44,600 | $386,250 |
| 2016 | $8,828 | $324,660 | $44,600 | $280,060 |
| 2015 | $7,348 | $324,660 | $44,600 | $280,060 |
| 2014 | $7,348 | $324,660 | $44,600 | $280,060 |
Source: Public Records
Map
Nearby Homes
- 723 Skillman St
- 6006 Swiss Ave
- 6116 Gaston Ave
- 6005 Worth St
- 1507 Abrams Rd
- 711 Glendale St
- 1600 Abrams Rd Unit 30
- 6248 Oram St Unit 6
- 5833 Victor St
- 700 N Beacon St
- 1844 Mecca St
- 6246 Prospect Ave
- 5705 Live Oak St Unit B
- 5647 Live Oak St
- 5963 Ross Ave Unit 202
- 5620 Live Oak St Unit 104
- 5620 Live Oak St Unit 106
- 6001 Lewis St
- 6001 Lewis St Unit 102
- 6303 Prospect Ave Unit B104
- 857 N Glasgow Dr
- 857 N Glasgow Dr
- 857 N Glasgow Dr Unit B
- 5916 Gaston Ave Unit 304
- 5916 Gaston Ave Unit 303A
- 5916 Gaston Ave Unit 302A
- 5916 Gaston Ave Unit 301A
- 5916 Gaston Ave Unit 205A
- 5916 Gaston Ave Unit 204A
- 5916 Gaston Ave Unit 203A
- 5916 Gaston Ave Unit 201A
- 5916 Gaston Ave Unit 105A
- 5916 Gaston Ave Unit 104A
- 5916 Gaston Ave Unit 103A
- 5916 Gaston Ave Unit 102A
- 5916 Gaston Ave Unit 101A
- 5916 Gaston Ave
- 5916 Gaston Ave
- 710 N Glasgow Dr
- 6000 Gaston Ave Unit 201