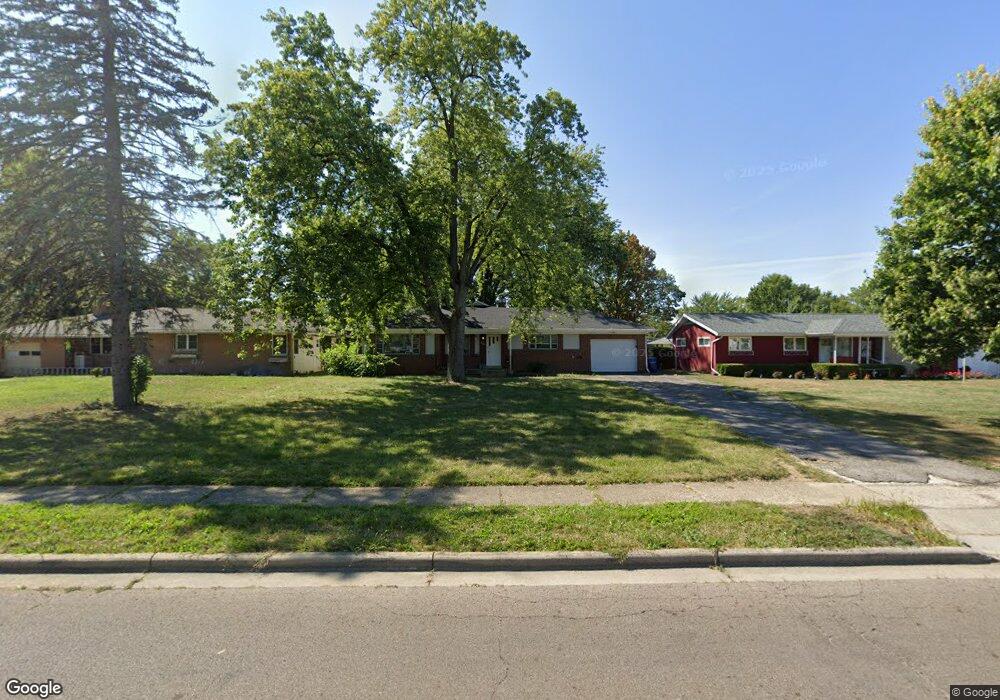
857 Ross Rd Columbus, OH 43213
Estimated Value: $295,983 - $314,000
5
Beds
2
Baths
1,888
Sq Ft
$160/Sq Ft
Est. Value
About This Home
This home is located at 857 Ross Rd, Columbus, OH 43213 and is currently estimated at $301,746, approximately $159 per square foot. 857 Ross Rd is a home located in Franklin County with nearby schools including Etna Road Elementary School, Beechwood Elementary School, and Rosemore Middle School.
Ownership History
Date
Name
Owned For
Owner Type
Purchase Details
Closed on
Apr 17, 2023
Sold by
Doorvest Holdings I Llc
Bought by
Bagga Jaspreet
Current Estimated Value
Home Financials for this Owner
Home Financials are based on the most recent Mortgage that was taken out on this home.
Original Mortgage
$202,500
Outstanding Balance
$195,274
Interest Rate
5.99%
Mortgage Type
New Conventional
Estimated Equity
$106,472
Purchase Details
Closed on
Dec 13, 2022
Sold by
Discovery City Holdings Llc
Bought by
Doorvest Holdings I Llc
Purchase Details
Closed on
Nov 25, 2022
Sold by
Baker Dianne E
Bought by
Discovery City Holdings Llc
Purchase Details
Closed on
Jun 6, 1988
Bought by
Baker David K and Baker Dianne E
Purchase Details
Closed on
Aug 1, 1978
Create a Home Valuation Report for This Property
The Home Valuation Report is an in-depth analysis detailing your home's value as well as a comparison with similar homes in the area
Home Values in the Area
Average Home Value in this Area
Purchase History
| Date | Buyer | Sale Price | Title Company |
|---|---|---|---|
| Bagga Jaspreet | $270,000 | Beeline Title Llc | |
| Doorvest Holdings I Llc | $160,100 | Empora Title | |
| Discovery City Holdings Llc | $75,000 | Bridge Title & Escrow Services | |
| Baker David K | -- | -- | |
| -- | $70,000 | -- |
Source: Public Records
Mortgage History
| Date | Status | Borrower | Loan Amount |
|---|---|---|---|
| Open | Bagga Jaspreet | $202,500 |
Source: Public Records
Tax History
| Year | Tax Paid | Tax Assessment Tax Assessment Total Assessment is a certain percentage of the fair market value that is determined by local assessors to be the total taxable value of land and additions on the property. | Land | Improvement |
|---|---|---|---|---|
| 2025 | $4,438 | $95,800 | $20,510 | $75,290 |
| 2024 | $4,438 | $95,800 | $20,510 | $75,290 |
| 2023 | $4,259 | $95,800 | $20,510 | $75,290 |
| 2022 | $2,497 | $52,470 | $9,630 | $42,840 |
| 2021 | $2,345 | $52,470 | $9,630 | $42,840 |
| 2020 | $2,321 | $52,470 | $9,630 | $42,840 |
| 2019 | $2,029 | $41,970 | $7,700 | $34,270 |
| 2018 | $2,038 | $41,970 | $7,700 | $34,270 |
| 2017 | $1,960 | $41,970 | $7,700 | $34,270 |
| 2016 | $1,991 | $39,240 | $7,420 | $31,820 |
| 2015 | $2,008 | $39,240 | $7,420 | $31,820 |
| 2014 | $2,009 | $39,240 | $7,420 | $31,820 |
| 2013 | $1,092 | $43,610 | $8,260 | $35,350 |
Source: Public Records
Map
Nearby Homes
- 706 Ross Rd
- 1085 S Hamilton Rd
- 745 Pierce Ave
- 695 Erickson Ave
- 963 Erickson Ave
- 4662 Jae Ave
- 798 S Yearling Rd
- 4174 Wright Park
- 957 Rose Place
- 491 Westphal Ave
- 1193 Marble Dr
- 1229 Simpson Dr
- 1243 Simpson Dr
- 1281 Maetzel Dr
- 1284 Thurston Dr
- 4481 Chandler Dr
- 1301 Bernhard Rd
- 4212 Seigman Ave
- 845 Exeter Rd
- 1356 Harlow Rd
Your Personal Tour Guide
Ask me questions while you tour the home.