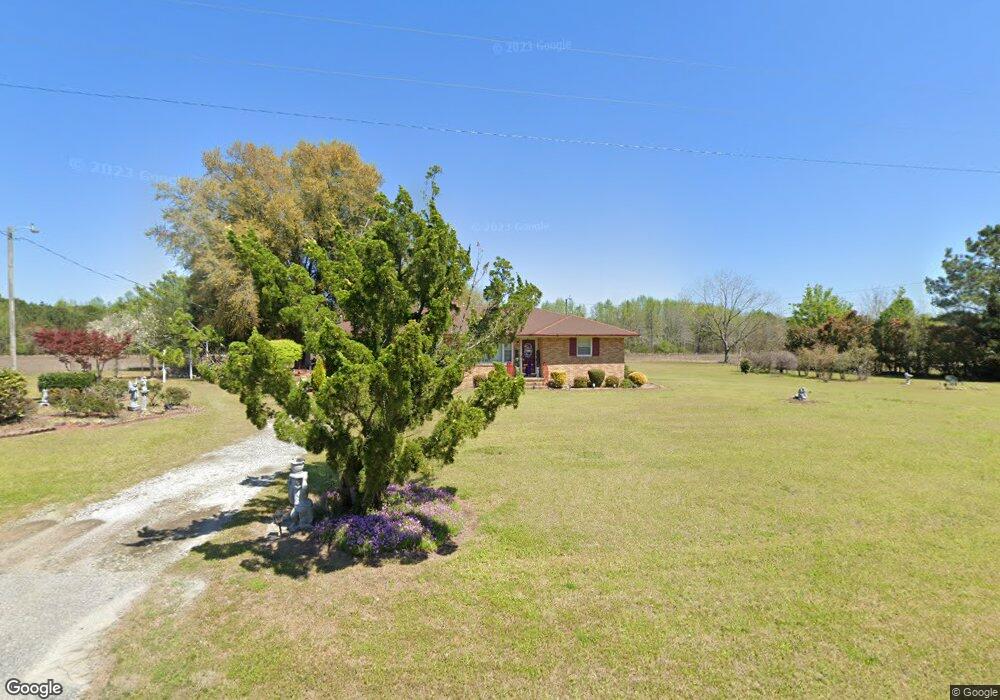
8574 Boggy Branch Rd Nichols, SC 29581
Estimated Value: $179,000 - $293,000
3
Beds
1
Bath
1,324
Sq Ft
$160/Sq Ft
Est. Value
About This Home
This home is located at 8574 Boggy Branch Rd, Nichols, SC 29581 and is currently estimated at $211,828, approximately $159 per square foot. 8574 Boggy Branch Rd is a home with nearby schools including Green Sea Floyds Elementary School and Green Sea Floyds High School.
Ownership History
Date
Name
Owned For
Owner Type
Purchase Details
Closed on
Jul 16, 2007
Sold by
Cox Myrle Hammond
Bought by
Cox Cheryl L
Current Estimated Value
Create a Home Valuation Report for This Property
The Home Valuation Report is an in-depth analysis detailing your home's value as well as a comparison with similar homes in the area
Home Values in the Area
Average Home Value in this Area
Purchase History
| Date | Buyer | Sale Price | Title Company |
|---|---|---|---|
| Cox Cheryl L | -- | None Available | |
| Cox Myrle Hammond | -- | None Available |
Source: Public Records
Tax History Compared to Growth
Tax History
| Year | Tax Paid | Tax Assessment Tax Assessment Total Assessment is a certain percentage of the fair market value that is determined by local assessors to be the total taxable value of land and additions on the property. | Land | Improvement |
|---|---|---|---|---|
| 2024 | $419 | $10,182 | $4,200 | $5,982 |
| 2023 | $419 | $3,120 | $592 | $2,528 |
| 2021 | $195 | $5,405 | $887 | $4,518 |
| 2020 | $142 | $5,405 | $887 | $4,518 |
| 2019 | $142 | $5,405 | $887 | $4,518 |
| 2018 | $108 | $4,069 | $799 | $3,270 |
| 2017 | $93 | $4,069 | $799 | $3,270 |
| 2016 | -- | $4,069 | $799 | $3,270 |
| 2015 | $93 | $4,070 | $800 | $3,270 |
| 2014 | $88 | $4,070 | $800 | $3,270 |
Source: Public Records
Map
Nearby Homes
- 9100 Quarter Horse Dr
- 0 S Carolina 9
- 0 Elvington Rd
- Tbd Highway 9 W
- TBD Highway 9 W
- 3369 Highway 430
- TBD Sand Plant Rd
- 7766 Highway 9 Unit Lot 5
- 7766 Highway 9 Unit Lot 3
- 7766 Highway 9 Unit Lot 1
- 7766 Highway 9 Unit Lot 4
- TBD Highway 430
- Lot 1 Highway 430
- 0 Hwy 430 Unit 23463510
- Lot 3 Highway 430
- Lot 2 Highway 430
- Tbd Fifteen Mile Bay Rd
- 0 S Nichols Hwy Unit SC 29581 Horry Coun
- tbd Highway 19 Unit Tract 9
- TBD Hamps Rd
- 8721 Boggy Branch Rd
- 8580 Boggy Branch Rd
- 8830 Boggy Branch Rd
- 8961 Boggy Branch Rd
- 8672 Highway 9
- 3900 Sun Cove Rd
- 3820 Sun Cove Rd
- 8431 Elvington Rd
- 8854 Highway 9
- 8858 Highway 9
- 8665 Highway 9
- 8865 Highway 9
- 0 Quarter Horse Rd Unit 1415617
- 8855 Highway 9
- 8951 Boggy Branch Rd
- Tract 3 Elvington Rd Unit 11.70 Acres
- Tract 1 ,3 Elvington Rd Unit 21.70 Acres
- 0 Quarter Horse Dr Unit 1412921
- 4200 Pleasantdale Rd
- 4210 Pleasantdale Rd