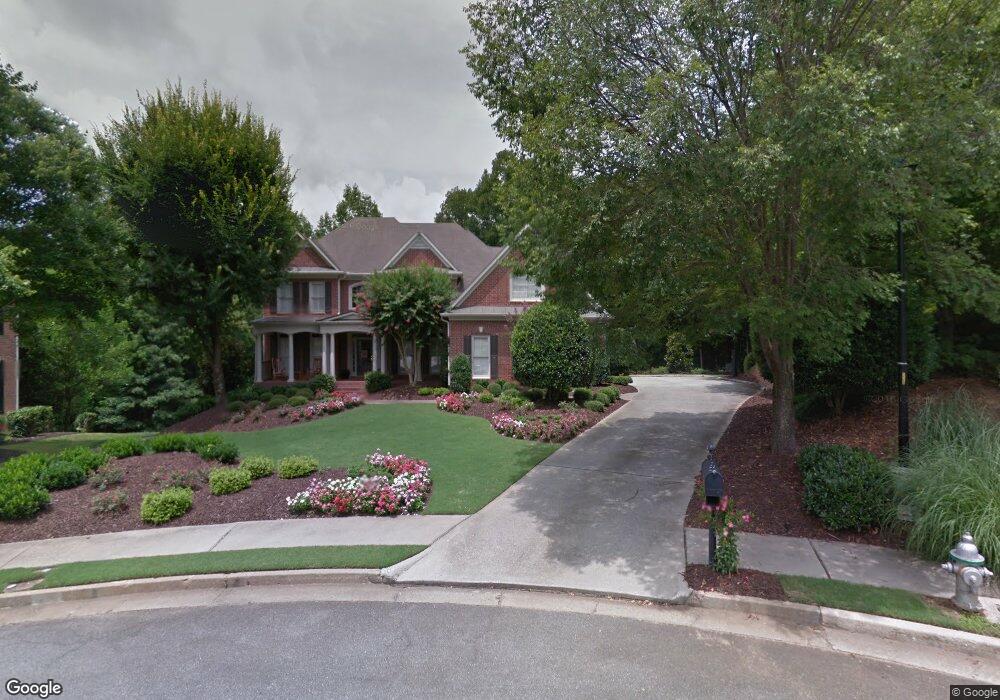
8575 High Hampton Chase Unit IV Alpharetta, GA 30022
Estimated Value: $938,835 - $1,210,000
5
Beds
4
Baths
3,395
Sq Ft
$318/Sq Ft
Est. Value
About This Home
This home is located at 8575 High Hampton Chase Unit IV, Alpharetta, GA 30022 and is currently estimated at $1,079,209, approximately $317 per square foot. 8575 High Hampton Chase Unit IV is a home located in Fulton County with nearby schools including Dolvin Elementary School, Autrey Mill Middle School, and Johns Creek High School.
Ownership History
Date
Name
Owned For
Owner Type
Purchase Details
Closed on
Mar 18, 2002
Sold by
Mcilwaine John C
Bought by
Mcilwaine John C and Mcilwaine Kelli J
Current Estimated Value
Home Financials for this Owner
Home Financials are based on the most recent Mortgage that was taken out on this home.
Original Mortgage
$435,000
Interest Rate
6.38%
Mortgage Type
New Conventional
Purchase Details
Closed on
Mar 31, 2000
Sold by
John Wieland Homes & Neighborhoo
Bought by
Mcilwaine John C and Mcilwaine Kelli J
Home Financials for this Owner
Home Financials are based on the most recent Mortgage that was taken out on this home.
Original Mortgage
$418,705
Interest Rate
7.75%
Mortgage Type
New Conventional
Create a Home Valuation Report for This Property
The Home Valuation Report is an in-depth analysis detailing your home's value as well as a comparison with similar homes in the area
Home Values in the Area
Average Home Value in this Area
Purchase History
| Date | Buyer | Sale Price | Title Company |
|---|---|---|---|
| Mcilwaine John C | -- | -- | |
| Mcilwaine John C | -- | -- | |
| Mcilwaine John C | $523,400 | -- |
Source: Public Records
Mortgage History
| Date | Status | Borrower | Loan Amount |
|---|---|---|---|
| Open | Mcilwaine John C | $435,000 | |
| Previous Owner | Mcilwaine John C | $418,705 |
Source: Public Records
Tax History Compared to Growth
Tax History
| Year | Tax Paid | Tax Assessment Tax Assessment Total Assessment is a certain percentage of the fair market value that is determined by local assessors to be the total taxable value of land and additions on the property. | Land | Improvement |
|---|---|---|---|---|
| 2025 | $1,223 | $308,800 | $66,080 | $242,720 |
| 2023 | $10,580 | $374,840 | $132,120 | $242,720 |
| 2022 | $5,893 | $300,200 | $81,040 | $219,160 |
| 2021 | $6,974 | $262,520 | $99,200 | $163,320 |
| 2020 | $7,015 | $251,000 | $96,880 | $154,120 |
| 2019 | $1,060 | $225,920 | $73,480 | $152,440 |
| 2018 | $6,457 | $249,280 | $64,520 | $184,760 |
| 2017 | $5,710 | $207,640 | $85,840 | $121,800 |
| 2016 | $5,709 | $207,640 | $85,840 | $121,800 |
| 2015 | $6,726 | $207,640 | $85,840 | $121,800 |
| 2014 | $5,974 | $207,640 | $85,840 | $121,800 |
Source: Public Records
Map
Nearby Homes
- 725 High Hampton Run
- 10625 Haynes Forest Dr
- 870 Thornberry Dr Unit 2
- 1050 Ambrose Ave Unit 1
- 420 Seale Trail
- 225 Wentworth Terrace
- 10505 Ash Rill Dr
- 3335 Waters Mill Dr
- 10421 Park Walk Point
- 3075 Glen Knolls Ct
- 2718 Wander Ln
- 3430 Waters Mill Dr
- 10340 Rillridge Ct
- 3345 Switchbark Ln
- 3077 Haynes Trail
- 1105 Sterling Brooke Dr
- 122 Pinecone Pkwy
- 3040 Roxburgh Dr
- 8590 High Hampton Chase
- 8584 High Hampton Chase
- 8565 High Hampton Chase
- 8580 High Hampton Chase
- 8555 High Hampton Chase
- 8570 High Hampton Chase
- 1910 Hill Chase
- 8545 High Hampton Chase
- 8560 High Hampton Chase
- 1915 Hill Chase
- 1900 Hill Chase
- 8535 High Hampton Chase
- 8550 High Hampton Chase Unit 4
- 1905 Hill Chase
- 1890 Hill Chase
- 8525 High Hampton Chase Unit IV
- 8540 High Hampton Chase
- 1880 Hill Chase
- 1885 Hill Chase