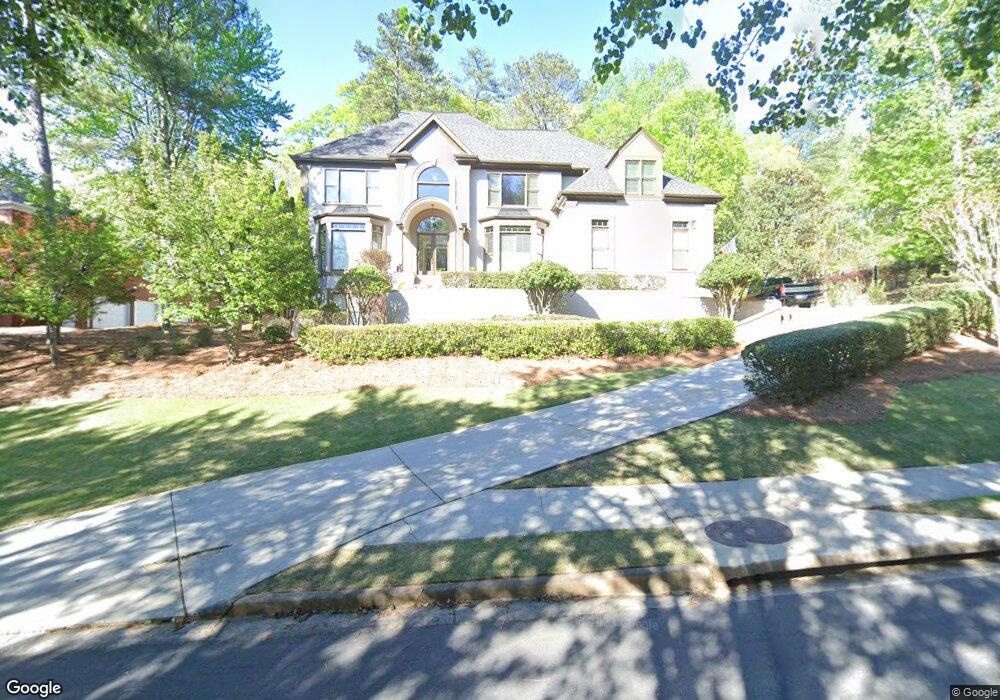
8575 Sentinae Chase Dr Roswell, GA 30076
Estimated Value: $790,000 - $1,158,000
4
Beds
5
Baths
4,662
Sq Ft
$207/Sq Ft
Est. Value
About This Home
This home is located at 8575 Sentinae Chase Dr, Roswell, GA 30076 and is currently estimated at $965,471, approximately $207 per square foot. 8575 Sentinae Chase Dr is a home located in Fulton County with nearby schools including River Eves Elementary School, Holcomb Bridge Middle School, and Centennial High School.
Ownership History
Date
Name
Owned For
Owner Type
Purchase Details
Closed on
Dec 22, 2010
Sold by
Deutsche Bk Trust Co America
Bought by
Searles Christopher Y and Searles Myra W
Current Estimated Value
Home Financials for this Owner
Home Financials are based on the most recent Mortgage that was taken out on this home.
Original Mortgage
$333,000
Outstanding Balance
$219,558
Interest Rate
4.18%
Mortgage Type
New Conventional
Estimated Equity
$745,913
Purchase Details
Closed on
Jun 1, 2010
Sold by
Gibbins Malcolm
Bought by
Deutsche Bank Trust Co America
Purchase Details
Closed on
Oct 4, 2005
Sold by
Macpherson Thomas R and Macpherson Lois S
Bought by
Gibbins Malcolm
Home Financials for this Owner
Home Financials are based on the most recent Mortgage that was taken out on this home.
Original Mortgage
$468,750
Interest Rate
5.66%
Mortgage Type
New Conventional
Purchase Details
Closed on
Oct 28, 1996
Sold by
Harrison Harrison Resid Inc
Bought by
Macpherson Thomas Lois
Create a Home Valuation Report for This Property
The Home Valuation Report is an in-depth analysis detailing your home's value as well as a comparison with similar homes in the area
Home Values in the Area
Average Home Value in this Area
Purchase History
| Date | Buyer | Sale Price | Title Company |
|---|---|---|---|
| Searles Christopher Y | $370,000 | -- | |
| Deutsche Bank Trust Co America | $380,000 | -- | |
| Gibbins Malcolm | $625,000 | -- | |
| Macpherson Thomas Lois | $471,000 | -- |
Source: Public Records
Mortgage History
| Date | Status | Borrower | Loan Amount |
|---|---|---|---|
| Open | Searles Christopher Y | $333,000 | |
| Previous Owner | Gibbins Malcolm | $468,750 | |
| Closed | Macpherson Thomas Lois | $0 |
Source: Public Records
Tax History Compared to Growth
Tax History
| Year | Tax Paid | Tax Assessment Tax Assessment Total Assessment is a certain percentage of the fair market value that is determined by local assessors to be the total taxable value of land and additions on the property. | Land | Improvement |
|---|---|---|---|---|
| 2025 | $1,487 | $278,720 | $82,040 | $196,680 |
| 2023 | $8,484 | $300,560 | $82,040 | $218,520 |
| 2022 | $6,133 | $233,120 | $36,720 | $196,400 |
| 2021 | $6,404 | $201,080 | $31,680 | $169,400 |
| 2020 | $6,421 | $196,080 | $24,600 | $171,480 |
| 2019 | $1,064 | $214,680 | $40,720 | $173,960 |
| 2018 | $5,916 | $209,600 | $39,760 | $169,840 |
| 2017 | $5,375 | $184,240 | $43,400 | $140,840 |
| 2016 | $5,377 | $184,240 | $43,400 | $140,840 |
| 2015 | $6,404 | $184,240 | $43,400 | $140,840 |
| 2014 | $4,638 | $151,320 | $37,640 | $113,680 |
Source: Public Records
Map
Nearby Homes
- 110 Larne Ct
- 1789 Riverside Rd
- 1785 Riverside Rd
- 8320 Sentinae Chase Dr
- 1670 Riverside Rd
- 945 Club Chase Ct
- 9445 Mistwater Close
- 2525 Spalding Dr
- 2413 Spalding Dr
- 920 Renaissance Way
- 325 Riverhall Ct Unit 5
- 2660 Spalding Dr
- 2615 Spalding Dr
- 110 River Terrace Point
- 8705 River Bluff Ln
- 1115 Canyon Point Cir
- 3040 Gray Hawk Ln
- 3001 Canyon Point Cir
- 3209 Canyon Point Cir
- 415 Cliffcove Ct
- 8585 Sentinae Chase Dr
- 300 Tradea Tarn
- 205 Wicklawn Way
- 8595 Sentinae Chase Dr Unit 1
- 120 Kilrain Ct Unit 2
- 215 Wicklawn Way Unit 2
- 125 Kilrain Ct
- 110 Kilrain Ct
- 8555 Sentinae Chase Dr
- 200 Wicklawn Way
- 8155 Sentinae Chase Dr
- 8620 Sentinae Chase Dr Unit 1
- 225 Wicklawn Way
- 115 Kilrain Ct
- 320 Tradea Tarn
- 0 Wicklawn Way
- 8545 Sentinae Chase Dr
- 210 Wicklawn Way
- 210 Wicklawn Way Unit 1
- 100 Kilrain Ct Unit 2