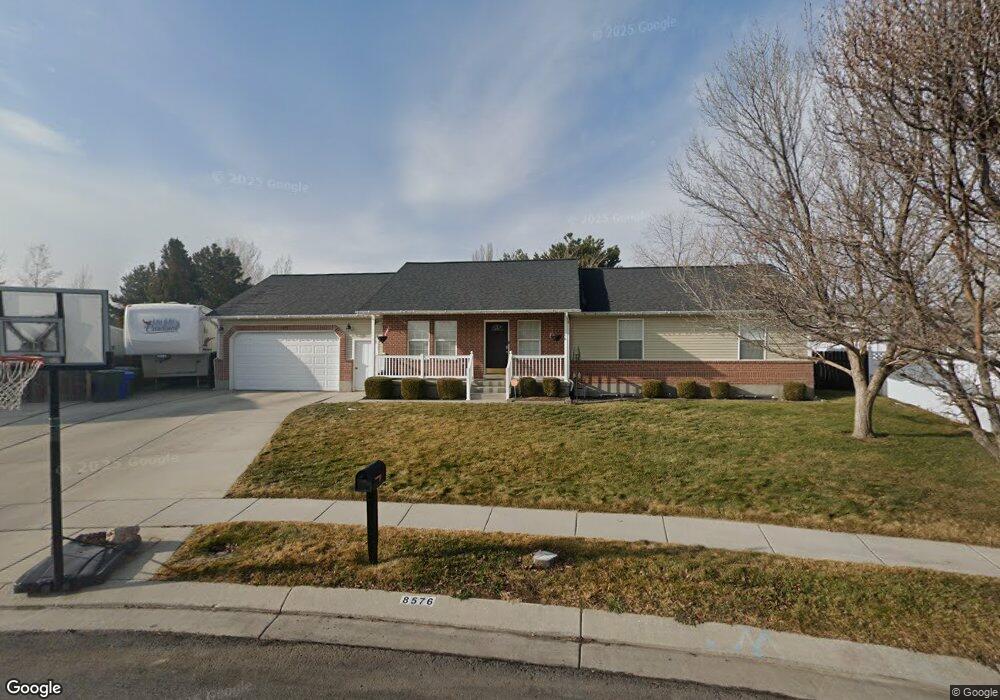
8576 Festive Way Unit 50 West Jordan, UT 84088
Jordan Oaks NeighborhoodEstimated Value: $599,000 - $647,000
4
Beds
3
Baths
1,533
Sq Ft
$403/Sq Ft
Est. Value
About This Home
This home is located at 8576 Festive Way Unit 50, West Jordan, UT 84088 and is currently estimated at $617,277, approximately $402 per square foot. 8576 Festive Way Unit 50 is a home located in Salt Lake County with nearby schools including Jordan Hills Elementary School, West Hills Middle School, and Copper Hills High School.
Ownership History
Date
Name
Owned For
Owner Type
Purchase Details
Closed on
May 17, 2013
Sold by
Parker John S and Parker Micheller
Bought by
Beams Christopher W and Beams Jacquelynn
Current Estimated Value
Home Financials for this Owner
Home Financials are based on the most recent Mortgage that was taken out on this home.
Original Mortgage
$268,055
Outstanding Balance
$187,971
Interest Rate
3.25%
Mortgage Type
FHA
Estimated Equity
$429,306
Purchase Details
Closed on
Dec 24, 1996
Sold by
Design Builders L C
Bought by
Parker John S and Parker Michelle
Home Financials for this Owner
Home Financials are based on the most recent Mortgage that was taken out on this home.
Original Mortgage
$30,690
Interest Rate
7.59%
Purchase Details
Closed on
Apr 30, 1996
Sold by
Prp Development L C
Bought by
Design Builders L C
Home Financials for this Owner
Home Financials are based on the most recent Mortgage that was taken out on this home.
Original Mortgage
$18,050
Interest Rate
7.82%
Create a Home Valuation Report for This Property
The Home Valuation Report is an in-depth analysis detailing your home's value as well as a comparison with similar homes in the area
Home Values in the Area
Average Home Value in this Area
Purchase History
| Date | Buyer | Sale Price | Title Company |
|---|---|---|---|
| Beams Christopher W | -- | Unity Title Llc | |
| Parker John S | -- | -- | |
| Design Builders L C | -- | -- |
Source: Public Records
Mortgage History
| Date | Status | Borrower | Loan Amount |
|---|---|---|---|
| Open | Beams Christopher W | $268,055 | |
| Previous Owner | Parker John S | $30,690 | |
| Previous Owner | Design Builders L C | $18,050 |
Source: Public Records
Tax History Compared to Growth
Tax History
| Year | Tax Paid | Tax Assessment Tax Assessment Total Assessment is a certain percentage of the fair market value that is determined by local assessors to be the total taxable value of land and additions on the property. | Land | Improvement |
|---|---|---|---|---|
| 2025 | $3,009 | $585,300 | $182,800 | $402,500 |
| 2024 | $3,009 | $578,900 | $181,000 | $397,900 |
| 2023 | $3,009 | $551,500 | $170,700 | $380,800 |
| 2022 | $3,028 | $540,200 | $167,400 | $372,800 |
| 2021 | $2,559 | $415,500 | $130,100 | $285,400 |
| 2020 | $2,390 | $364,300 | $130,100 | $234,200 |
| 2019 | $2,355 | $351,900 | $122,800 | $229,100 |
| 2018 | $2,230 | $330,600 | $122,800 | $207,800 |
| 2017 | $2,029 | $299,400 | $122,800 | $176,600 |
| 2016 | $1,971 | $273,300 | $122,800 | $150,500 |
| 2015 | $2,034 | $275,000 | $129,800 | $145,200 |
| 2014 | $1,877 | $249,800 | $119,300 | $130,500 |
Source: Public Records
Map
Nearby Homes
- 8359 Etude Dr
- 4624 Pine Crossing Dr
- 4887 W 8620 S
- 7903 Mckenzie Ln
- 7886 Mckenzie Ln
- 8941 S Sun Leaf Dr
- 8577 Autumn Gold Cir
- 8322 Copper Vista Cir
- 7973 S Nebo Dr
- 4678 Emmons Dr
- 8400 S 4000 W Unit 134
- 3977 W Elwood Way
- 3888 W 8700 S
- 5098 Cherry Laurel Ln
- 4707 W Granada Hills Ct
- 8453 S Windmill Dr
- 4904 Wild Acres Dr
- 9353 S 4460 W
- 8854 Rocky Creek Dr
- 7908 Cold Stone Ln Unit N3
- 8576 Festive Way
- 4553 Mardi Gras Ln
- 8581 S 4590 W
- 8581 S 4590 W Unit 415
- 4553 W Mardi Gras Ln
- 8562 Festive Way
- 8569 S 4590 W
- 8569 S 4590 W Unit 414
- 8565 Festive Way
- 4568 Dorilee Dr
- 4539 W Mardi Gras Ln
- 4539 Mardi Gras Ln
- 4601 W 8580 S
- 8553 S 4590 W
- 8546 Festive Way
- 4586 Dorilee Dr
- 4556 Dorilee Dr
- 8547 Festive Way
- 8547 S Festive Way
- 8564 Mardi Gras Ln