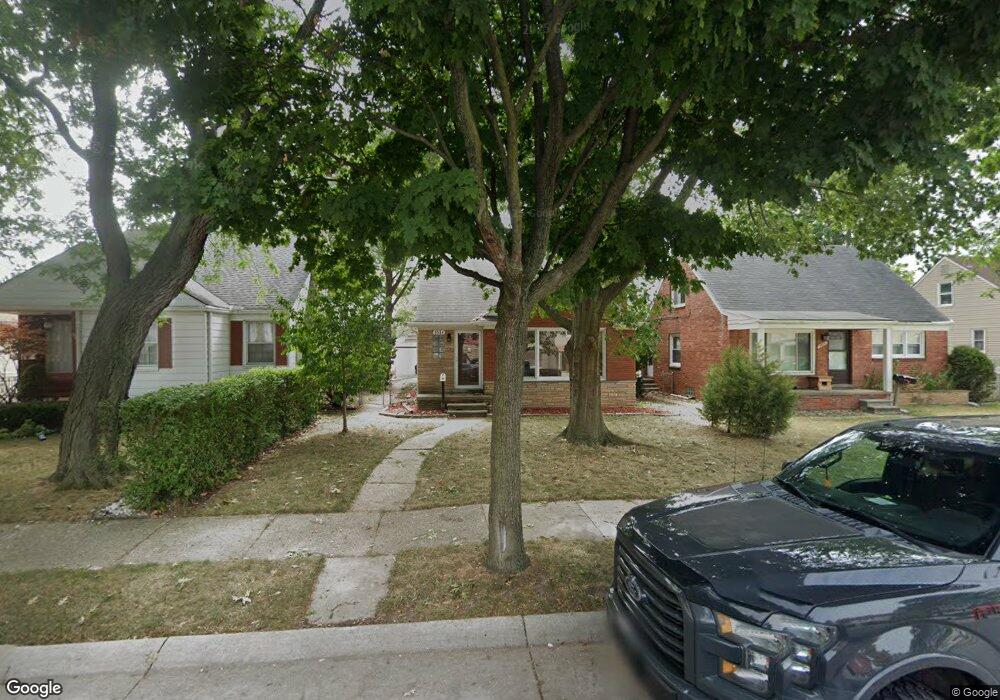
8576 Harding Unit Bldg-Unit Center Line, MI 48015
Estimated Value: $177,000 - $214,000
3
Beds
2
Baths
1,382
Sq Ft
$139/Sq Ft
Est. Value
About This Home
This home is located at 8576 Harding Unit Bldg-Unit, Center Line, MI 48015 and is currently estimated at $191,911, approximately $138 per square foot. 8576 Harding Unit Bldg-Unit is a home located in Macomb County with nearby schools including May V. Peck Elementary School, Wolfe Middle School, and Center Line High School.
Ownership History
Date
Name
Owned For
Owner Type
Purchase Details
Closed on
Mar 1, 2018
Sold by
Thomas
Bought by
Mazza Jason
Current Estimated Value
Home Financials for this Owner
Home Financials are based on the most recent Mortgage that was taken out on this home.
Original Mortgage
$88,350
Outstanding Balance
$75,089
Interest Rate
4.04%
Mortgage Type
New Conventional
Estimated Equity
$116,822
Purchase Details
Closed on
Nov 9, 2009
Sold by
Cusumano Giuseppe and Cusumano Jazmin
Bought by
Thomas Ericka M
Home Financials for this Owner
Home Financials are based on the most recent Mortgage that was taken out on this home.
Original Mortgage
$41,729
Interest Rate
4.9%
Mortgage Type
FHA
Purchase Details
Closed on
Apr 10, 2006
Sold by
Cusumano Giuseppe
Bought by
Cusumano Giuseppe and Cusumano Jazmin
Create a Home Valuation Report for This Property
The Home Valuation Report is an in-depth analysis detailing your home's value as well as a comparison with similar homes in the area
Home Values in the Area
Average Home Value in this Area
Purchase History
| Date | Buyer | Sale Price | Title Company |
|---|---|---|---|
| Mazza Jason | $93,000 | None Available | |
| Thomas Ericka M | $42,500 | Warranty Title Agency Llc | |
| Cusumano Giuseppe | -- | Multiple | |
| Cusumano Giuseppe | -- | None Available |
Source: Public Records
Mortgage History
| Date | Status | Borrower | Loan Amount |
|---|---|---|---|
| Open | Mazza Jason | $88,350 | |
| Previous Owner | Thomas Ericka M | $41,729 |
Source: Public Records
Tax History Compared to Growth
Tax History
| Year | Tax Paid | Tax Assessment Tax Assessment Total Assessment is a certain percentage of the fair market value that is determined by local assessors to be the total taxable value of land and additions on the property. | Land | Improvement |
|---|---|---|---|---|
| 2025 | $4,076 | $85,500 | $0 | $0 |
| 2024 | $3,095 | $79,400 | $0 | $0 |
| 2023 | $2,914 | $71,900 | $0 | $0 |
| 2022 | $3,729 | $62,800 | $0 | $0 |
| 2021 | $3,842 | $57,700 | $0 | $0 |
| 2020 | $2,955 | $53,500 | $0 | $0 |
| 2019 | $2,299 | $48,000 | $0 | $0 |
| 2018 | $2,476 | $41,530 | $0 | $0 |
| 2017 | $2,371 | $37,070 | $4,770 | $32,300 |
| 2016 | $2,299 | $37,070 | $0 | $0 |
| 2015 | -- | $33,050 | $0 | $0 |
| 2011 | -- | $39,110 | $3,730 | $35,380 |
Source: Public Records
Map
Nearby Homes
- 8565 Dale
- 8385 Helen
- 25113 Campbell Ave
- 8174 Helen
- 24899 Campbell Ave
- 8330 Sunburst
- 8071 Harding
- 11245 Mae Ave
- 11175 Sunburst Ave
- 24800 Campbell Ave
- 11370 E 10 Mile Rd
- 8134 Lillian
- 26431 Tom Allen Dr
- 8602 Kaltz St
- 8121 Edward
- 7399 Gronow
- 26466 Richard Dr
- 26032 Falmouth Dr
- 8755 Sterling St
- 8665 Sterling