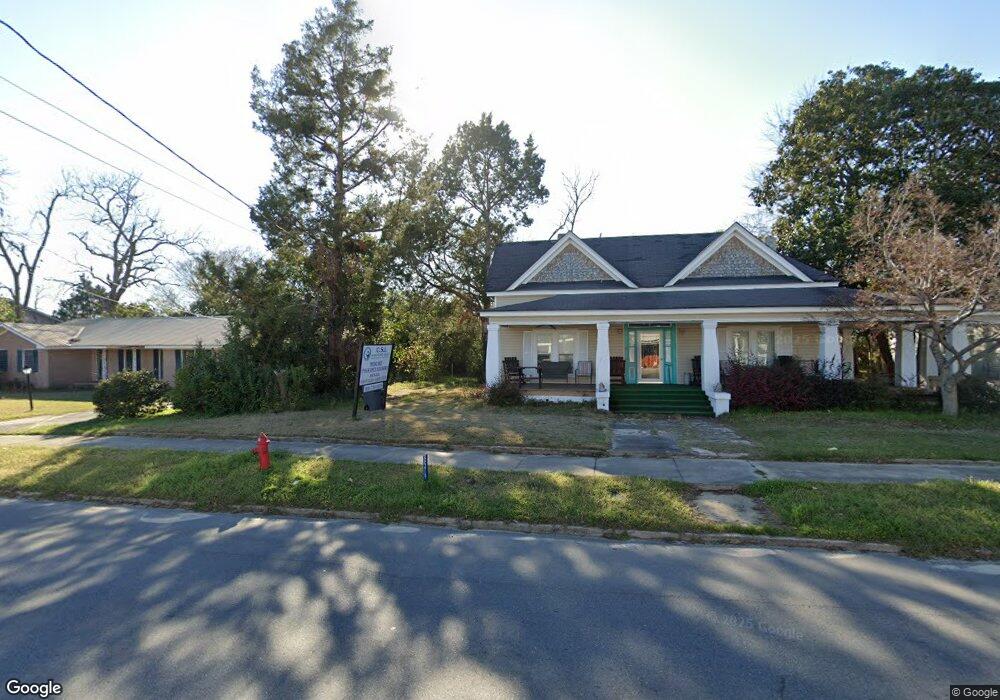
8579 S Marcus St Wrightsville, GA 31096
Estimated Value: $86,666 - $137,000
--
Bed
--
Bath
1,648
Sq Ft
$68/Sq Ft
Est. Value
About This Home
This home is located at 8579 S Marcus St, Wrightsville, GA 31096 and is currently estimated at $111,917, approximately $67 per square foot. 8579 S Marcus St is a home with nearby schools including Johnson County Elementary School, Johnson County Middle School, and Johnson County High School.
Ownership History
Date
Name
Owned For
Owner Type
Purchase Details
Closed on
Jun 29, 2016
Sold by
Community Bank Of Johnson
Bought by
Walker James Melvin and Walker Dorothy Jean
Current Estimated Value
Home Financials for this Owner
Home Financials are based on the most recent Mortgage that was taken out on this home.
Original Mortgage
$13,600
Outstanding Balance
$10,885
Interest Rate
3.66%
Mortgage Type
New Conventional
Estimated Equity
$101,032
Purchase Details
Closed on
Nov 3, 2015
Sold by
Bright Gina T
Bought by
Community Bank Of Johnson Coun
Purchase Details
Closed on
Jul 30, 2002
Sold by
Schimpf Nancy A
Bought by
Bright Michael D and Bright Gina T
Purchase Details
Closed on
Jun 30, 2000
Sold by
Prince Jr Charles H
Bought by
Schimpf Nancy A
Purchase Details
Closed on
Jul 28, 1998
Sold by
Roy Roy J and Roy Rowland
Bought by
Prince Jr Charles H
Create a Home Valuation Report for This Property
The Home Valuation Report is an in-depth analysis detailing your home's value as well as a comparison with similar homes in the area
Home Values in the Area
Average Home Value in this Area
Purchase History
| Date | Buyer | Sale Price | Title Company |
|---|---|---|---|
| Walker James Melvin | $17,000 | -- | |
| Community Bank Of Johnson Coun | -- | -- | |
| Community Bank Of Johnson Coun | -- | -- | |
| Bright Michael D | $69,000 | -- | |
| Schimpf Nancy A | $57,900 | -- | |
| Prince Jr Charles H | $25,000 | -- |
Source: Public Records
Mortgage History
| Date | Status | Borrower | Loan Amount |
|---|---|---|---|
| Open | Walker James Melvin | $13,600 |
Source: Public Records
Tax History Compared to Growth
Tax History
| Year | Tax Paid | Tax Assessment Tax Assessment Total Assessment is a certain percentage of the fair market value that is determined by local assessors to be the total taxable value of land and additions on the property. | Land | Improvement |
|---|---|---|---|---|
| 2024 | $1,100 | $26,083 | $2,254 | $23,829 |
| 2023 | $1,037 | $26,083 | $2,254 | $23,829 |
| 2022 | $1,037 | $26,083 | $2,254 | $23,829 |
| 2021 | $843 | $21,705 | $2,254 | $19,451 |
| 2020 | $808 | $18,848 | $2,254 | $16,594 |
| 2019 | $818 | $18,848 | $2,254 | $16,594 |
| 2018 | $732 | $18,848 | $2,254 | $16,594 |
| 2017 | $290 | $23,067 | $2,254 | $20,813 |
| 2016 | $896 | $23,067 | $2,254 | $20,813 |
| 2015 | -- | $24,808 | $2,254 | $22,555 |
| 2014 | -- | $24,808 | $2,254 | $22,555 |
| 2013 | -- | $24,808 | $2,253 | $22,554 |
Source: Public Records
Map
Nearby Homes
- 6887 W College St
- 4772 Georgia 57
- 537 W Court St
- 8427 S Marcus St
- 3 Chester Dr
- 11 Hill St
- 304 W Trilby St
- 0 W Elm St
- 107 Wiggins St
- 2254 W Elm St
- 2237 W Elm St
- 8165 S Marcus St
- 691 W Trilby St
- 7728 Georgia 15
- 964 Cross Cedar Rd
- 230 Pringle Rd
- 0 Tucker Grove Church Rd Unit 243840
- 0 Tucker Grove Church Rd Unit 28000
- 0 Tucker Grove Church Rd Unit 10321264
- 1936 Ga Highway 57 W
- 8585 S Marcus St
- 150 S Marcus St
- 8569 S Marcus St
- 8569 S Marcus St
- 107 E Deer St
- 277 S Myrtle Ave
- 277 S Myrtle Ave
- 319 S Myrtle Ave
- 305 S Marcus St
- 319 S Myrtle Ave
- 8561 S Marcus St
- 8561 S Marcus St
- 403 S Marcus St
- 8580 S Marcus St
- 321 S Myrtle Ave
- 8598 S Marcus St
- 8603 S Marcus St
- 8553 S Marcus St
- 6 W Hawk St
- 320 S Myrtle St