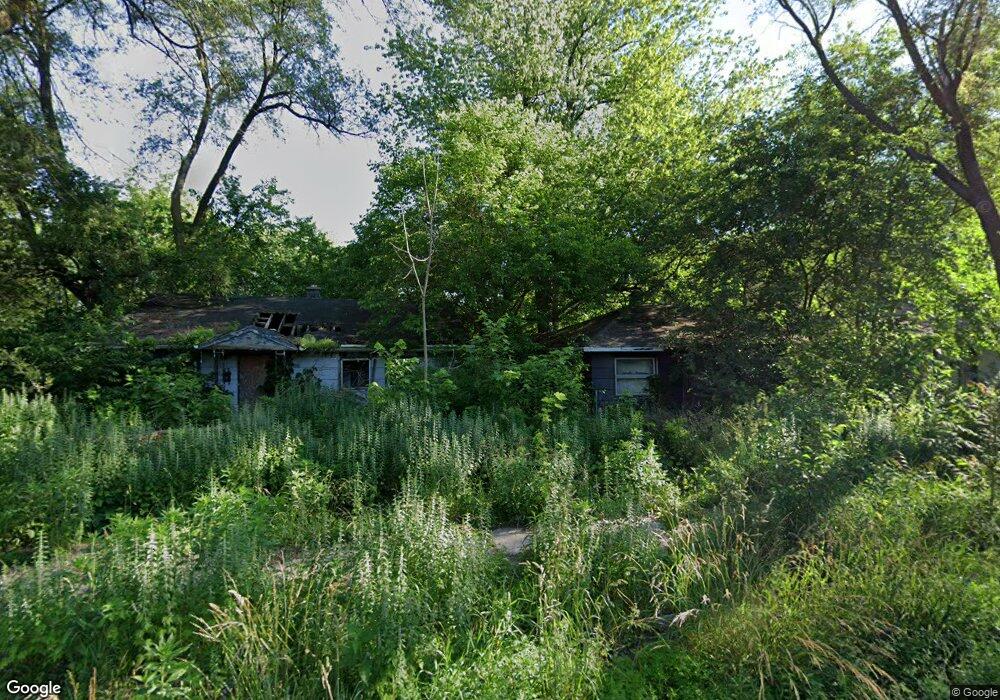
858 E 35th Ct Gary, IN 46409
Glen Park NeighborhoodEstimated Value: $79,000 - $96,000
3
Beds
1
Bath
918
Sq Ft
$95/Sq Ft
Est. Value
About This Home
This home is located at 858 E 35th Ct, Gary, IN 46409 and is currently estimated at $87,500, approximately $95 per square foot. 858 E 35th Ct is a home located in Lake County with nearby schools including Glen Park Academy for Excellence in Learning, Bailly Preparatory Academy, and West Side Leadership Academy.
Ownership History
Date
Name
Owned For
Owner Type
Purchase Details
Closed on
Sep 23, 2016
Sold by
Hunt R
Bought by
City Of Redevelopment Commission
Current Estimated Value
Purchase Details
Closed on
Dec 22, 2011
Sold by
Greenberg Harris Investments Llc
Bought by
Hunt R
Purchase Details
Closed on
Apr 22, 2009
Sold by
Stonecrest Investments Llc
Bought by
Greenberg Harris Investments Llc
Purchase Details
Closed on
Nov 20, 2008
Sold by
Sb Holdings Llc
Bought by
Stonecrest Investments Llc
Purchase Details
Closed on
Jul 29, 2008
Sold by
U S Bank National Association
Bought by
Sb Holdings Llc
Purchase Details
Closed on
Apr 4, 2007
Sold by
Lasenby Muriel
Bought by
U S Bank Na and Holders Of The Terwin Mortgage Trust 200
Purchase Details
Closed on
Feb 13, 2006
Sold by
Cy Investment Properties Llc
Bought by
Lasenby Muriel
Home Financials for this Owner
Home Financials are based on the most recent Mortgage that was taken out on this home.
Original Mortgage
$53,100
Interest Rate
9.8%
Mortgage Type
Fannie Mae Freddie Mac
Create a Home Valuation Report for This Property
The Home Valuation Report is an in-depth analysis detailing your home's value as well as a comparison with similar homes in the area
Home Values in the Area
Average Home Value in this Area
Purchase History
| Date | Buyer | Sale Price | Title Company |
|---|---|---|---|
| City Of Redevelopment Commission | -- | None Available | |
| Hunt R | $716 | None Available | |
| Greenberg Harris Investments Llc | $3,750 | None Available | |
| Stonecrest Investments Llc | -- | None Available | |
| Sb Holdings Llc | -- | Meridian Title Corp | |
| U S Bank Na | $64,284 | None Available | |
| Lasenby Muriel | -- | Indiana Title Network Co |
Source: Public Records
Mortgage History
| Date | Status | Borrower | Loan Amount |
|---|---|---|---|
| Previous Owner | Lasenby Muriel | $53,100 |
Source: Public Records
Tax History
| Year | Tax Paid | Tax Assessment Tax Assessment Total Assessment is a certain percentage of the fair market value that is determined by local assessors to be the total taxable value of land and additions on the property. | Land | Improvement |
|---|---|---|---|---|
| 2025 | -- | -- | -- | -- |
| 2024 | -- | -- | -- | -- |
| 2023 | -- | -- | -- | -- |
| 2021 | -- | $0 | $0 | $0 |
| 2020 | $0 | $0 | $0 | $0 |
| 2019 | $0 | $0 | $0 | $0 |
| 2018 | $0 | $0 | $0 | $0 |
| 2017 | $0 | $0 | $0 | $0 |
| 2016 | $148 | $6,500 | $2,800 | $3,700 |
| 2014 | $754 | $32,200 | $2,900 | $29,300 |
| 2013 | $708 | $31,500 | $2,900 | $28,600 |
Source: Public Records
Map
Nearby Homes
- 1027 E 35th Place
- 3583 Carolina St
- 3516 Carolina St
- 3625 Virginia St
- 1407 E 36th Ave
- 3789 Rhode Island St
- 445 E Ridge Rd
- 3540 Pennsylvania St
- 3836 Delaware St
- 3564 Massachusetts St
- 3912 Virginia St
- 3936 Tennessee St
- 3820 Swift St
- 4001 Virginia St
- 3966 Louisiana St
- 4755-59 Connecticut St
- 3847 Broadway
- 3744 Washington St
- 200 W 36th Place
- 4019 Pennsylvania St
- 864 E 35th Ct
- 850 E 35th Ct
- 872 E 35th Ct
- 900 E 35th Ave
- 878 E 35th Ct
- 3487 Rhode Island St
- 853 E 35th Ct
- 865 E 35th Ct
- 886 E 35th Ct
- 845 E 35th Ct
- 877 E 35th Ct
- 3481 Rhode Island St
- 3494 Rhode Island Ct
- 3494 Rhode Island St
- 822 E 35th Ct
- 883 E 35th Ct
- 894 E 35th Ct
- 837 E 35th Ct
- 3475 Rhode Island Ct
- 3486 Rhode Island St
Your Personal Tour Guide
Ask me questions while you tour the home.