Estimated Value: $124,000 - $197,694
3
Beds
2
Baths
1,236
Sq Ft
$137/Sq Ft
Est. Value
About This Home
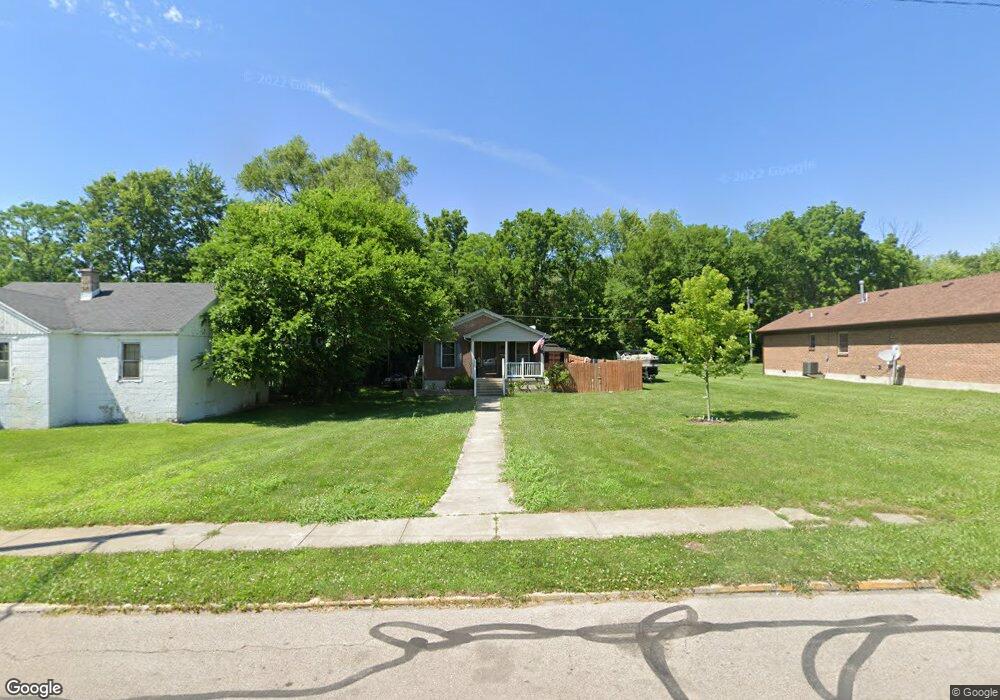
This home is located at 858 E Church St, Xenia, OH 45385 and is currently estimated at $169,174, approximately $136 per square foot. 858 E Church St is a home located in Greene County with nearby schools including Xenia High School, Summit Academy Community School for Alternative Learners - Xenia, and Legacy Christian Academy.
Ownership History
Date
Name
Owned For
Owner Type
Purchase Details
Closed on
Sep 12, 2013
Sold by
Skg Properties Llc
Bought by
Porter Gerald M
Current Estimated Value
Home Financials for this Owner
Home Financials are based on the most recent Mortgage that was taken out on this home.
Original Mortgage
$65,000
Outstanding Balance
$48,486
Interest Rate
4.39%
Mortgage Type
VA
Estimated Equity
$120,688
Purchase Details
Closed on
Apr 19, 2013
Sold by
Federal National Mortgage Association
Bought by
Skg Properties Llc
Purchase Details
Closed on
Mar 2, 2012
Sold by
Porter Marsha Sue
Bought by
Federal National Mortgage Association
Purchase Details
Closed on
Jan 20, 2005
Sold by
Porter Gerald M and Porter Betty E
Bought by
Porter Marsha Sue
Purchase Details
Closed on
Oct 18, 2001
Sold by
Porter Harrison
Bought by
Porter Gerald M
Create a Home Valuation Report for This Property
The Home Valuation Report is an in-depth analysis detailing your home's value as well as a comparison with similar homes in the area
Home Values in the Area
Average Home Value in this Area
Purchase History
| Date | Buyer | Sale Price | Title Company |
|---|---|---|---|
| Porter Gerald M | $65,000 | None Available | |
| Skg Properties Llc | $37,500 | First American Title | |
| Federal National Mortgage Association | $136,500 | None Available | |
| Porter Marsha Sue | -- | -- | |
| Porter Gerald M | -- | -- |
Source: Public Records
Mortgage History
| Date | Status | Borrower | Loan Amount |
|---|---|---|---|
| Open | Porter Gerald M | $65,000 |
Source: Public Records
Tax History Compared to Growth
Tax History
| Year | Tax Paid | Tax Assessment Tax Assessment Total Assessment is a certain percentage of the fair market value that is determined by local assessors to be the total taxable value of land and additions on the property. | Land | Improvement |
|---|---|---|---|---|
| 2024 | $2,335 | $54,560 | $1,820 | $52,740 |
| 2023 | $2,335 | $54,560 | $1,820 | $52,740 |
| 2022 | $1,915 | $38,170 | $1,660 | $36,510 |
| 2021 | $1,941 | $38,170 | $1,660 | $36,510 |
| 2020 | $1,859 | $38,170 | $1,660 | $36,510 |
| 2019 | $1,673 | $32,330 | $1,520 | $30,810 |
| 2018 | $1,679 | $32,330 | $1,520 | $30,810 |
| 2017 | $1,631 | $32,330 | $1,520 | $30,810 |
| 2016 | $1,735 | $32,770 | $1,520 | $31,250 |
| 2015 | $1,740 | $32,770 | $1,520 | $31,250 |
| 2014 | $1,666 | $32,770 | $1,520 | $31,250 |
Source: Public Records
Map
Nearby Homes
- 846 E Church St
- 840 E Church St
- 890 E Church St
- 863 E Church St
- 818 E Church St
- 900 E Church St
- 849 E Church St
- 873 E Church St
- 841 E Church St
- 840 Clark St
- 885 E Church St
- 806 E Church St
- 831 E Church St
- 211 Mulberry St Unit 217
- 821 E Church St
- 897 E Church St
- 792 E Church St
- 807 E Church St
- 907 E Church St
- 924 E Church St