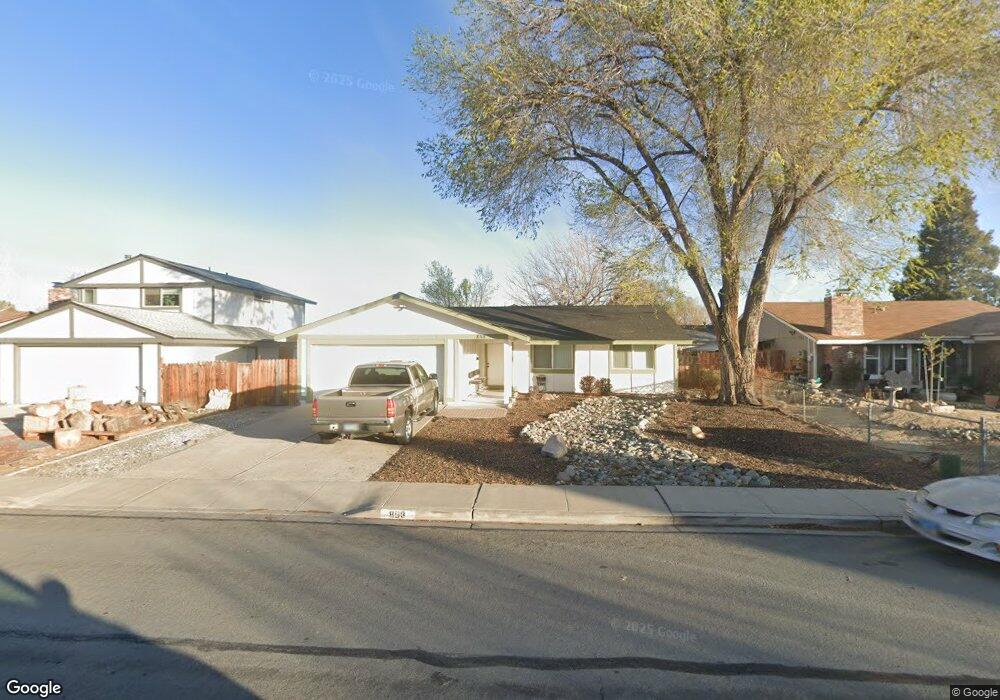
858 E York Way Sparks, NV 89434
O'Callaghan NeighborhoodEstimated Value: $404,000 - $475,000
4
Beds
2
Baths
1,403
Sq Ft
$314/Sq Ft
Est. Value
About This Home
This home is located at 858 E York Way, Sparks, NV 89434 and is currently estimated at $440,120, approximately $313 per square foot. 858 E York Way is a home located in Washoe County with nearby schools including Katherine Dunn Elementary School, George L Dilworth Middle School, and Edward C Reed High School.
Ownership History
Date
Name
Owned For
Owner Type
Purchase Details
Closed on
Jul 11, 2011
Sold by
Housing Authority Of The City Of Reno
Bought by
Nevada Rural Housing Authority
Current Estimated Value
Purchase Details
Closed on
Oct 29, 2010
Sold by
Grist Kim
Bought by
Housing Authority Of The City Of Reno
Purchase Details
Closed on
Mar 9, 2010
Sold by
Siviglia Of Nevada Llc
Bought by
Grist Gregory Spencer
Purchase Details
Closed on
Mar 21, 2007
Sold by
Grist Kim I
Bought by
Siviglia Of Nevada Llc
Purchase Details
Closed on
Aug 9, 2006
Sold by
Grist Kim I
Bought by
Grist Gregory Spencer and Spencer Grist G
Home Financials for this Owner
Home Financials are based on the most recent Mortgage that was taken out on this home.
Original Mortgage
$234,000
Interest Rate
3.25%
Mortgage Type
Negative Amortization
Purchase Details
Closed on
Mar 3, 2006
Sold by
Johnson Leslie B
Bought by
Grist G Spencer and Grist Kim I
Create a Home Valuation Report for This Property
The Home Valuation Report is an in-depth analysis detailing your home's value as well as a comparison with similar homes in the area
Home Values in the Area
Average Home Value in this Area
Purchase History
| Date | Buyer | Sale Price | Title Company |
|---|---|---|---|
| Nevada Rural Housing Authority | -- | None Available | |
| Housing Authority Of The City Of Reno | -- | First Centennial Reno | |
| Grist Gregory Spencer | $99,000 | None Available | |
| Siviglia Of Nevada Llc | -- | None Available | |
| Grist Kim I | -- | None Available | |
| Grist Gregory Spencer | -- | Ticor Title Of Nevada Inc | |
| Grist G Spencer | $260,000 | Founders Title Company Of Nv |
Source: Public Records
Mortgage History
| Date | Status | Borrower | Loan Amount |
|---|---|---|---|
| Previous Owner | Grist Gregory Spencer | $234,000 |
Source: Public Records
Tax History Compared to Growth
Tax History
| Year | Tax Paid | Tax Assessment Tax Assessment Total Assessment is a certain percentage of the fair market value that is determined by local assessors to be the total taxable value of land and additions on the property. | Land | Improvement |
|---|---|---|---|---|
| 2025 | $8 | $59,759 | $37,275 | $22,484 |
| 2024 | $8 | $54,835 | $32,620 | $22,215 |
| 2023 | $5 | $52,301 | $31,710 | $20,591 |
| 2022 | $4 | $44,236 | $27,475 | $16,762 |
| 2021 | $4 | $38,447 | $21,175 | $17,272 |
| 2020 | $5 | $38,379 | $20,510 | $17,869 |
| 2019 | $5 | $36,683 | $18,865 | $17,818 |
| 2018 | $5 | $31,327 | $13,405 | $17,922 |
| 2017 | $5 | $31,220 | $12,810 | $18,410 |
| 2016 | $3 | $31,589 | $12,355 | $19,234 |
| 2015 | $4 | $29,446 | $9,695 | $19,751 |
| 2014 | $4 | $27,867 | $8,435 | $19,432 |
| 2013 | -- | $25,612 | $6,055 | $19,557 |
Source: Public Records
Map
Nearby Homes
- 913 Glen Molly Dr
- 745 Glen Vista Dr
- 1051 Glen Martin Dr
- 1095 E York Way
- 1973 Rio Tinto Dr
- 1128 Bradley Square
- 3167 Bristle Branch Dr
- 1897 Bonita Vista Dr
- 3188 Bristle Branch Dr
- 1029 Baywood Dr Unit D
- 3198 Bristle Branch Dr
- 3200 Bristle Branch Dr
- 3104 Sandy St
- 1970 Woodhaven Ln
- 3071 Meadowlands Dr
- 1035 Baywood Dr Unit D
- 930 Spanish Springs Rd
- 1055 Baywood Dr Unit D
- 1069 Palmwood Dr
- 2407 Sunny Slope Dr Unit 1
- 852 E York Way
- 864 E York Way
- 859 Glen Valley Dr
- 861 Glen Valley Dr Unit 2
- 849 Glen Valley Dr
- 844 E York Way
- 841 Glen Valley Dr
- 869 Glen Valley Dr
- 872 E York Way
- 859 E York Way
- 851 E York Way
- 863 E York Way
- 863 E York Way Unit NV
- 836 E York Way
- 882 E York Way
- 875 E York Way
- 845 E York Way
- 839 Glen Valley Dr
- 879 Glen Valley Dr
- 828 E York Way