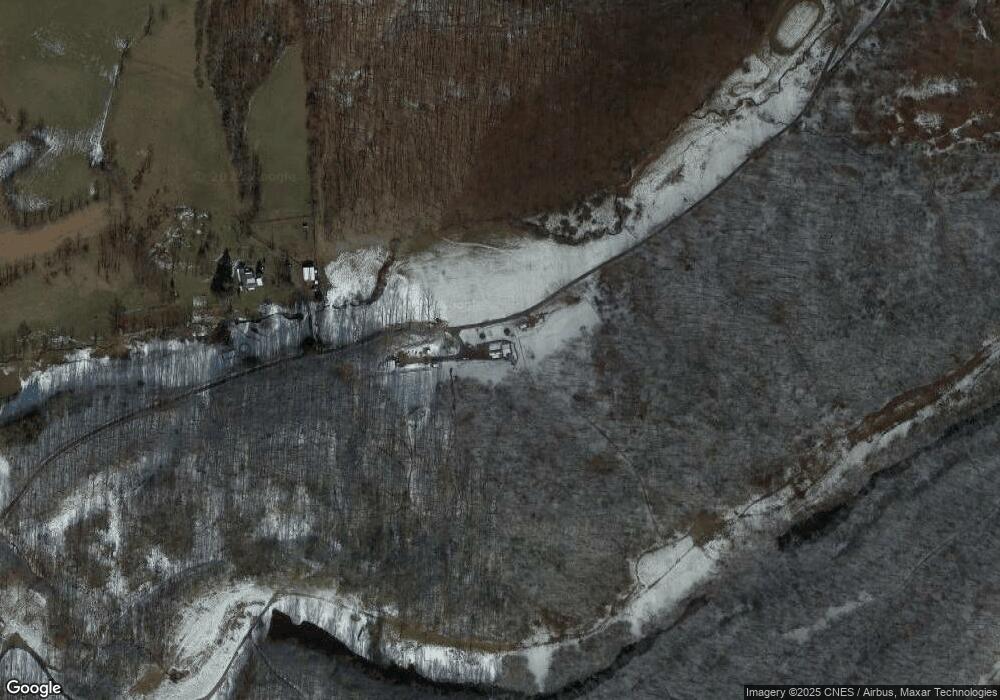
858 Glade Run Rd Bridgeport, WV 26330
Estimated Value: $229,000 - $467,000
3
Beds
3
Baths
2,392
Sq Ft
$149/Sq Ft
Est. Value
About This Home
This home is located at 858 Glade Run Rd, Bridgeport, WV 26330 and is currently estimated at $355,803, approximately $148 per square foot. 858 Glade Run Rd is a home.
Ownership History
Date
Name
Owned For
Owner Type
Purchase Details
Closed on
Nov 25, 2024
Sold by
Full Bore Drilling Llc
Bought by
Cobun Robert W
Current Estimated Value
Purchase Details
Closed on
Feb 15, 2018
Sold by
Turnbull John A and Turnbull Julie A
Bought by
Cobun Ii Robert W and Cobun Jessica M
Home Financials for this Owner
Home Financials are based on the most recent Mortgage that was taken out on this home.
Original Mortgage
$221,850
Interest Rate
4.04%
Mortgage Type
New Conventional
Create a Home Valuation Report for This Property
The Home Valuation Report is an in-depth analysis detailing your home's value as well as a comparison with similar homes in the area
Home Values in the Area
Average Home Value in this Area
Purchase History
| Date | Buyer | Sale Price | Title Company |
|---|---|---|---|
| Cobun Robert W | $220,000 | None Listed On Document | |
| Cobun Robert W | $220,000 | None Listed On Document | |
| Cobun Ii Robert W | $331,250 | -- |
Source: Public Records
Mortgage History
| Date | Status | Borrower | Loan Amount |
|---|---|---|---|
| Previous Owner | Cobun Ii Robert W | $221,850 |
Source: Public Records
Tax History Compared to Growth
Tax History
| Year | Tax Paid | Tax Assessment Tax Assessment Total Assessment is a certain percentage of the fair market value that is determined by local assessors to be the total taxable value of land and additions on the property. | Land | Improvement |
|---|---|---|---|---|
| 2025 | $1,840 | $157,920 | $21,900 | $136,020 |
| 2024 | $1,840 | $150,780 | $21,900 | $128,880 |
| 2023 | $1,729 | $140,100 | $21,900 | $118,200 |
| 2022 | $1,656 | $140,520 | $21,900 | $118,620 |
| 2021 | $1,638 | $140,700 | $21,900 | $118,800 |
| 2020 | $1,619 | $140,400 | $21,900 | $118,500 |
| 2019 | $1,629 | $141,240 | $21,900 | $119,340 |
| 2018 | $1,653 | $143,940 | $21,360 | $122,580 |
| 2017 | $1,603 | $140,220 | $20,820 | $119,400 |
| 2016 | $1,559 | $138,120 | $19,740 | $118,380 |
| 2015 | $1,523 | $134,100 | $18,660 | $115,440 |
| 2014 | $1,494 | $131,760 | $17,040 | $114,720 |
Source: Public Records
Map
Nearby Homes
- TBD Coplin Run Rd
- TBD Green Valley Rd
- TBD Cleer Rd
- 131 Frisco Ln
- 390 Hog Heaven Farm Dr
- 10 Skyview Dr
- 44 Skyview Dr
- 11 Skyview Dr
- 47 Skyview Dr
- 5 Skyview Dr
- 45 Skyview Dr
- 6 Skyview Dr
- 46 Skyview Dr
- 49 Skyview Dr
- 9 Overlook Dr
- 3 Overlook Dr
- 15 Overlook Dr
- 184 Fairfax Dr
- 1 Overlook Dr
- 7644 Buckhannon Pike
