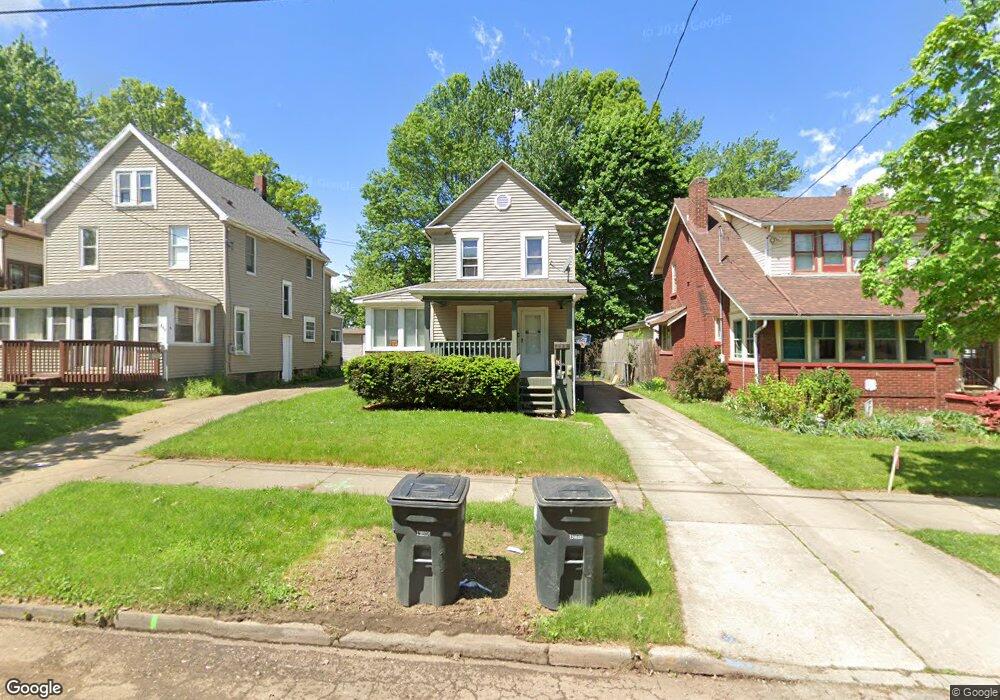
858 Kling St Akron, OH 44311
South Akron NeighborhoodEstimated Value: $53,000 - $94,000
3
Beds
2
Baths
1,088
Sq Ft
$64/Sq Ft
Est. Value
About This Home
This home is located at 858 Kling St, Akron, OH 44311 and is currently estimated at $70,017, approximately $64 per square foot. 858 Kling St is a home located in Summit County with nearby schools including McEbright Elementary School, Kenmore Garfield Community Learning Center, and Main Preparatory Academy.
Ownership History
Date
Name
Owned For
Owner Type
Purchase Details
Closed on
Sep 15, 2021
Sold by
King James Iv Llc
Bought by
King James 41 Llc
Current Estimated Value
Home Financials for this Owner
Home Financials are based on the most recent Mortgage that was taken out on this home.
Original Mortgage
$1,425,000
Interest Rate
3.01%
Mortgage Type
New Conventional
Purchase Details
Closed on
May 27, 2021
Sold by
Conrad Mark B
Bought by
King James Iv Llc
Purchase Details
Closed on
Sep 7, 2006
Sold by
Citimortgage Inc
Bought by
Conrad Mark B
Purchase Details
Closed on
Jun 30, 2006
Sold by
Jane William J
Bought by
Citifinancial Mortgage Co Inc
Purchase Details
Closed on
May 10, 1999
Sold by
Moore Charles E
Bought by
Jane William
Home Financials for this Owner
Home Financials are based on the most recent Mortgage that was taken out on this home.
Original Mortgage
$52,558
Interest Rate
7.04%
Create a Home Valuation Report for This Property
The Home Valuation Report is an in-depth analysis detailing your home's value as well as a comparison with similar homes in the area
Home Values in the Area
Average Home Value in this Area
Purchase History
| Date | Buyer | Sale Price | Title Company |
|---|---|---|---|
| King James 41 Llc | -- | Os National | |
| King James Iv Llc | $40,000 | Boston Natl Ttl Agcy Lllc | |
| Conrad Mark B | $23,400 | Resource Title Agency Inc | |
| Citifinancial Mortgage Co Inc | $40,000 | Resource Title Agency Inc | |
| Jane William | $29,000 | -- |
Source: Public Records
Mortgage History
| Date | Status | Borrower | Loan Amount |
|---|---|---|---|
| Previous Owner | King James 41 Llc | $1,425,000 | |
| Previous Owner | Jane William | $52,558 |
Source: Public Records
Tax History Compared to Growth
Tax History
| Year | Tax Paid | Tax Assessment Tax Assessment Total Assessment is a certain percentage of the fair market value that is determined by local assessors to be the total taxable value of land and additions on the property. | Land | Improvement |
|---|---|---|---|---|
| 2025 | $908 | $13,924 | $3,917 | $10,007 |
| 2024 | $908 | $13,924 | $3,917 | $10,007 |
| 2023 | $908 | $13,924 | $3,917 | $10,007 |
| 2022 | $723 | $8,190 | $2,303 | $5,887 |
| 2021 | $624 | $8,190 | $2,303 | $5,887 |
| 2020 | $615 | $8,190 | $2,300 | $5,890 |
| 2019 | $1,281 | $16,630 | $4,300 | $12,330 |
| 2018 | $1,265 | $16,630 | $4,300 | $12,330 |
| 2017 | $1,305 | $16,630 | $4,300 | $12,330 |
| 2016 | $1,306 | $16,910 | $4,300 | $12,610 |
| 2015 | $1,305 | $16,910 | $4,300 | $12,610 |
| 2014 | $1,295 | $16,910 | $4,300 | $12,610 |
| 2013 | $1,318 | $17,610 | $4,300 | $13,310 |
Source: Public Records
Map
Nearby Homes