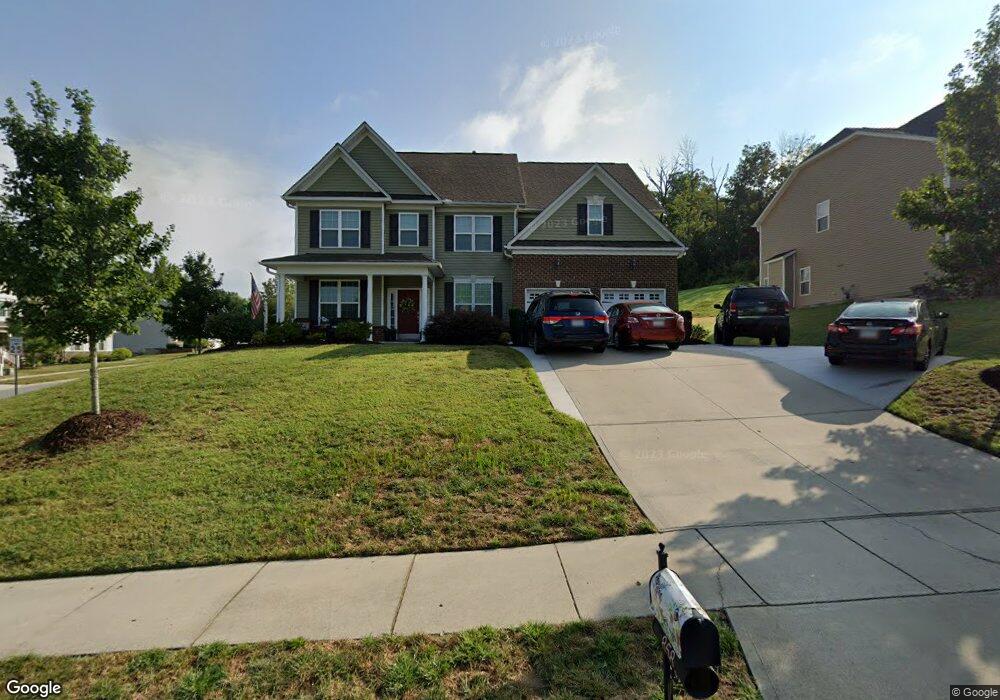
858 Langley Dr SE Unit 13 Concord, NC 28025
Estimated Value: $547,000 - $582,000
5
Beds
3
Baths
3,117
Sq Ft
$183/Sq Ft
Est. Value
About This Home
This home is located at 858 Langley Dr SE Unit 13, Concord, NC 28025 and is currently estimated at $570,837, approximately $183 per square foot. 858 Langley Dr SE Unit 13 is a home located in Cabarrus County with nearby schools including W.M. Irvin Elementary School, Mount Pleasant Middle School, and Mount Pleasant High School.
Ownership History
Date
Name
Owned For
Owner Type
Purchase Details
Closed on
Jun 7, 2019
Sold by
Opendoor Property C Llc
Bought by
Malcolm Wendell Corey and Malcolm Kelly Bowen R
Current Estimated Value
Home Financials for this Owner
Home Financials are based on the most recent Mortgage that was taken out on this home.
Original Mortgage
$220,000
Outstanding Balance
$193,042
Interest Rate
4%
Mortgage Type
New Conventional
Estimated Equity
$377,795
Purchase Details
Closed on
Dec 20, 2018
Sold by
Pilliner Andrew A and Pilliner Nicholine Vanessa
Bought by
Opendoor Property C Llc
Purchase Details
Closed on
Nov 25, 2015
Sold by
Niblock Homes Llc
Bought by
Pilliner Andrew A and Pilliner Nicholine Vanessa
Home Financials for this Owner
Home Financials are based on the most recent Mortgage that was taken out on this home.
Original Mortgage
$275,793
Interest Rate
3.87%
Mortgage Type
FHA
Purchase Details
Closed on
Jun 30, 2015
Sold by
Glp2 Partners Llc
Bought by
Niblock Homes Llc
Create a Home Valuation Report for This Property
The Home Valuation Report is an in-depth analysis detailing your home's value as well as a comparison with similar homes in the area
Home Values in the Area
Average Home Value in this Area
Purchase History
| Date | Buyer | Sale Price | Title Company |
|---|---|---|---|
| Malcolm Wendell Corey | $300,000 | None Available | |
| Opendoor Property C Llc | $3,294,500 | None Available | |
| Pilliner Andrew A | $285,000 | None Available | |
| Niblock Homes Llc | $48,000 | None Available |
Source: Public Records
Mortgage History
| Date | Status | Borrower | Loan Amount |
|---|---|---|---|
| Open | Malcolm Wendell Corey | $220,000 | |
| Previous Owner | Pilliner Andrew A | $275,793 |
Source: Public Records
Tax History Compared to Growth
Tax History
| Year | Tax Paid | Tax Assessment Tax Assessment Total Assessment is a certain percentage of the fair market value that is determined by local assessors to be the total taxable value of land and additions on the property. | Land | Improvement |
|---|---|---|---|---|
| 2025 | $5,233 | $525,430 | $110,000 | $415,430 |
| 2024 | $5,233 | $525,430 | $110,000 | $415,430 |
| 2023 | $4,284 | $351,160 | $73,000 | $278,160 |
| 2022 | $4,284 | $351,160 | $73,000 | $278,160 |
| 2021 | $4,284 | $351,160 | $73,000 | $278,160 |
| 2020 | $4,284 | $351,160 | $73,000 | $278,160 |
| 2019 | $3,737 | $306,350 | $48,000 | $258,350 |
| 2018 | $3,676 | $306,350 | $48,000 | $258,350 |
| 2017 | $3,615 | $306,350 | $48,000 | $258,350 |
| 2016 | $2,082 | $25,000 | $25,000 | $0 |
Source: Public Records
Map
Nearby Homes
- 2314 Fairport Dr SE
- 2365 Baxter Place SE
- 2369 Baxter Place SE
- 2625 Old Airport Rd
- 2817 Allendale Ct
- 1121 Setter Ln SE
- 153 Cottontail Ln SE Unit 46
- 1146 Crestmont Dr SE
- 2911 Buffalo Hills Dr
- 1076 Tangle Ridge Dr SE
- 1695 Lemming Dr
- 1508 Thompson Dr
- 2406 Everton Cir SE
- 1128 Tangle Ridge Dr SE
- 1197 Tangle Ridge Dr SE
- 51 Plott Dr SW
- 1665 Red Bird Cir
- 271 Ikerd Dr SE
- 46 Donna Dale Ave SE
- 79 Cumberland Ct SW
- 858 Langley Dr SE
- 854 Langley Dr SE Unit 12
- 2337 Fairport Dr SE Unit BFF014
- 2337 Fairport Dr SE Unit 14
- 2337 Fairport Dr SE
- 2342 Fairport Dr SE
- 850 Langley Dr SE Unit BFF11
- 850 Langley Dr SE
- 2338 Fairport Dr SE Unit 18
- 2338 Fairport Dr SE Unit 36
- 2333 Fairport Dr SE
- 859 Langley Dr SE Unit BFF38
- 859 Langley Dr SE
- 2336 Fairport Dr SE Unit BFF035
- 2336 Fairport Dr SE
- 855 Langley Dr SE Unit BFF39
- 855 Langley Dr SE
- 846 Langley Dr SE
- 846 Langley Dr SE Unit 10
- 851 Langley Dr SE