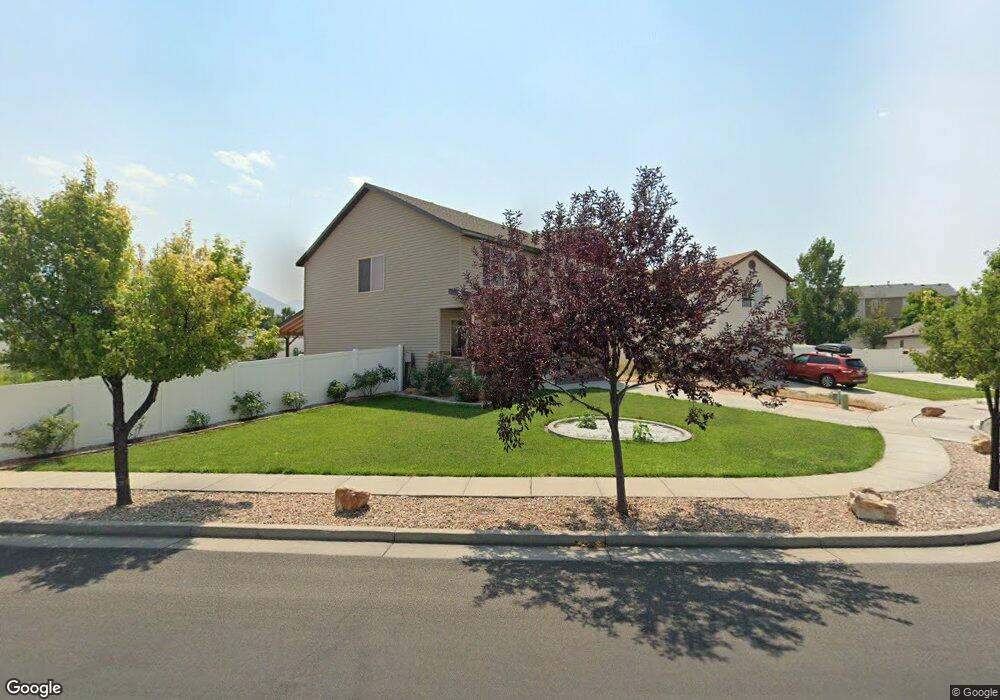
858 N 200 W Tooele, UT 84074
Estimated Value: $422,000 - $479,000
3
Beds
3
Baths
2,040
Sq Ft
$219/Sq Ft
Est. Value
About This Home
This home is located at 858 N 200 W, Tooele, UT 84074 and is currently estimated at $446,684, approximately $218 per square foot. 858 N 200 W is a home located in Tooele County with nearby schools including Northlake Elementary School, Tooele Junior High School, and Tooele High School.
Ownership History
Date
Name
Owned For
Owner Type
Purchase Details
Closed on
Jul 29, 2017
Sold by
Turnbow Jason M
Bought by
Dobieski Kevin Lance and Dobieski Lesa Nicole
Current Estimated Value
Home Financials for this Owner
Home Financials are based on the most recent Mortgage that was taken out on this home.
Original Mortgage
$215,151
Outstanding Balance
$179,284
Interest Rate
3.91%
Mortgage Type
New Conventional
Estimated Equity
$267,400
Purchase Details
Closed on
Jul 20, 2015
Sold by
Turnbow Jason M and Turnbow Tanya S
Bought by
Turnbow Jason M
Home Financials for this Owner
Home Financials are based on the most recent Mortgage that was taken out on this home.
Original Mortgage
$174,885
Interest Rate
3.87%
Mortgage Type
FHA
Purchase Details
Closed on
Jan 15, 2010
Sold by
Fieldstone Homes Utah Llc
Bought by
Turnbow Jason M and Turnbow Tanya S
Home Financials for this Owner
Home Financials are based on the most recent Mortgage that was taken out on this home.
Original Mortgage
$189,808
Interest Rate
4.75%
Mortgage Type
FHA
Create a Home Valuation Report for This Property
The Home Valuation Report is an in-depth analysis detailing your home's value as well as a comparison with similar homes in the area
Home Values in the Area
Average Home Value in this Area
Purchase History
| Date | Buyer | Sale Price | Title Company |
|---|---|---|---|
| Dobieski Kevin Lance | -- | Monument Title Insurance Inc | |
| Turnbow Jason M | -- | None Available | |
| Turnbow Jason M | -- | Bartlett Title Insurance Age |
Source: Public Records
Mortgage History
| Date | Status | Borrower | Loan Amount |
|---|---|---|---|
| Open | Dobieski Kevin Lance | $215,151 | |
| Previous Owner | Turnbow Jason M | $174,885 | |
| Previous Owner | Turnbow Jason M | $189,808 |
Source: Public Records
Tax History Compared to Growth
Tax History
| Year | Tax Paid | Tax Assessment Tax Assessment Total Assessment is a certain percentage of the fair market value that is determined by local assessors to be the total taxable value of land and additions on the property. | Land | Improvement |
|---|---|---|---|---|
| 2025 | $2,615 | $218,140 | $63,319 | $154,821 |
| 2024 | $2,651 | $202,374 | $63,319 | $139,055 |
| 2023 | $2,651 | $223,821 | $60,287 | $163,534 |
| 2022 | $2,915 | $250,806 | $72,432 | $178,374 |
| 2021 | $2,059 | $148,178 | $24,506 | $123,672 |
| 2020 | $1,965 | $245,322 | $44,556 | $200,766 |
| 2019 | $1,920 | $235,762 | $44,556 | $191,206 |
| 2018 | $1,735 | $202,039 | $40,000 | $162,039 |
| 2017 | $1,748 | $241,549 | $40,000 | $201,549 |
| 2016 | $1,537 | $126,857 | $20,625 | $106,232 |
| 2015 | $1,537 | $111,750 | $0 | $0 |
| 2014 | -- | $111,750 | $0 | $0 |
Source: Public Records
Map
Nearby Homes
- 705 N 200 E
- 834 N 200 W
- 272 W Quartz Rd
- 232 W 970 N
- 312 W Sapphire Dr
- 244 W 670 N
- 530 N 50 W
- 277 W 670 N
- 718 N 410 W
- 231 W 1160 N Unit 13
- 231 W 1160 N Unit 16
- 231 W 1160 N Unit 15
- 241 W 1160 N Unit 17
- 241 W 1160 N Unit 19
- 241 W 1160 N Unit 18
- 432 W Sapphire Dr Unit 7012
- 107 W 600 N Unit 204
- 251 W 1160 N Unit 23
- 251 W 1160 N Unit 22
- 435 W Sapphire Dr Unit 7037