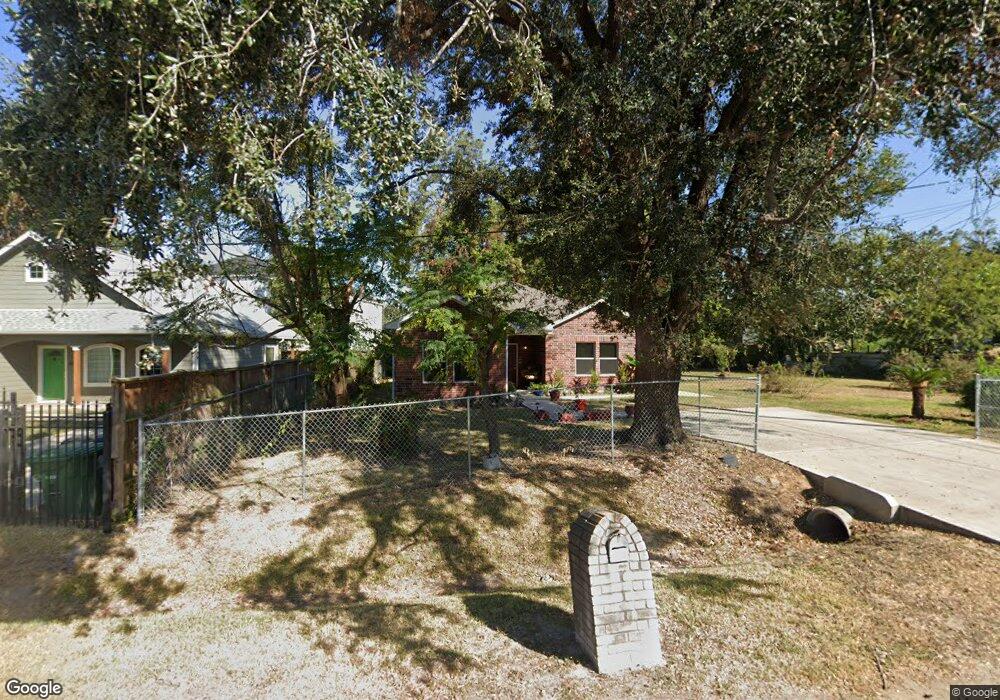
858 Prosper St Houston, TX 77088
Acres Homes NeighborhoodEstimated Value: $251,000 - $285,000
3
Beds
2
Baths
1,525
Sq Ft
$175/Sq Ft
Est. Value
About This Home
This home is located at 858 Prosper St, Houston, TX 77088 and is currently estimated at $267,606, approximately $175 per square foot. 858 Prosper St is a home located in Harris County with nearby schools including Osborne Elementary School, Williams Middle, and Booker T Washington Sr High.
Ownership History
Date
Name
Owned For
Owner Type
Purchase Details
Closed on
Sep 11, 2018
Sold by
Woods Annie
Bought by
Woods Waltine
Current Estimated Value
Purchase Details
Closed on
Aug 9, 2012
Sold by
Woods Cleayon
Bought by
Woods Annie and Woods Waltine
Purchase Details
Closed on
Oct 23, 2007
Sold by
Woods Annie L
Bought by
Woods Waltine and Woods Cleavon
Home Financials for this Owner
Home Financials are based on the most recent Mortgage that was taken out on this home.
Original Mortgage
$66,970
Interest Rate
6.32%
Mortgage Type
FHA
Purchase Details
Closed on
Oct 26, 1995
Sold by
Woods Diedre and Mathis Berretta Woods
Bought by
Woods Annie
Purchase Details
Closed on
Nov 11, 1994
Sold by
Wyatt Aron
Bought by
Woods Annie L
Purchase Details
Closed on
May 31, 1994
Sold by
Cotton Myra Jeffery
Bought by
Woods Annie
Create a Home Valuation Report for This Property
The Home Valuation Report is an in-depth analysis detailing your home's value as well as a comparison with similar homes in the area
Home Values in the Area
Average Home Value in this Area
Purchase History
| Date | Buyer | Sale Price | Title Company |
|---|---|---|---|
| Woods Waltine | -- | None Available | |
| Woods Annie | -- | None Available | |
| Woods Waltine | -- | American Title Co | |
| Woods Annie | -- | -- | |
| Woods Annie L | -- | -- | |
| Woods Annie | -- | -- |
Source: Public Records
Mortgage History
| Date | Status | Borrower | Loan Amount |
|---|---|---|---|
| Previous Owner | Woods Waltine | $66,970 |
Source: Public Records
Tax History Compared to Growth
Tax History
| Year | Tax Paid | Tax Assessment Tax Assessment Total Assessment is a certain percentage of the fair market value that is determined by local assessors to be the total taxable value of land and additions on the property. | Land | Improvement |
|---|---|---|---|---|
| 2025 | $1,601 | $278,967 | $79,540 | $199,427 |
| 2024 | $1,601 | $264,432 | $79,540 | $184,892 |
| 2023 | $1,601 | $268,239 | $79,540 | $188,699 |
| 2022 | $4,998 | $226,989 | $62,080 | $164,909 |
| 2021 | $1,656 | $100,845 | $40,740 | $60,105 |
| 2020 | $1,565 | $90,155 | $34,920 | $55,235 |
| 2019 | $1,486 | $87,049 | $31,040 | $56,009 |
| 2018 | $76 | $72,271 | $18,720 | $53,551 |
| 2017 | $1,227 | $48,541 | $12,480 | $36,061 |
| 2016 | $1,227 | $48,541 | $12,480 | $36,061 |
| 2015 | $1,175 | $45,722 | $12,480 | $33,242 |
| 2014 | $1,175 | $45,722 | $12,480 | $33,242 |
Source: Public Records
Map
Nearby Homes
- 862 Prosper St
- 7818 De Priest St
- 866 Prosper St
- 7816 De Priest St
- 850 Fair St
- 863 Fortune St
- 7814 De Priest St
- 859 Fortune St
- 846 Fair St
- 857 Prosper St
- 857 Fortune St Unit A
- 857 Fortune St
- 857 Fortune St Unit B
- O Knox
- 870 Prosper St
- 867 Prosper St
- 842 Fair St
- 7815 De Priest St
- 7817 De Priest St
- 7819 De Priest St