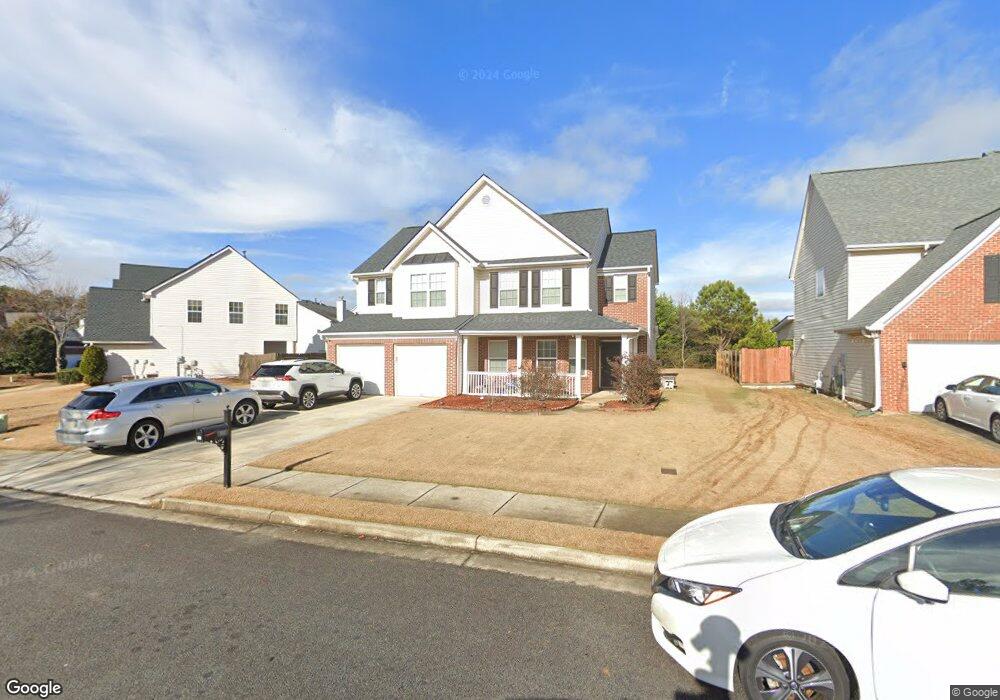
858 Roxholly Ln Unit 3 Buford, GA 30518
Estimated Value: $412,640 - $511,000
4
Beds
3
Baths
1,978
Sq Ft
$229/Sq Ft
Est. Value
About This Home
This home is located at 858 Roxholly Ln Unit 3, Buford, GA 30518 and is currently estimated at $452,160, approximately $228 per square foot. 858 Roxholly Ln Unit 3 is a home located in Gwinnett County with nearby schools including Sugar Hill Elementary School, Lanier Middle School, and Lanier High School.
Ownership History
Date
Name
Owned For
Owner Type
Purchase Details
Closed on
Nov 17, 2021
Sold by
Wesley Shafeek
Bought by
Wesley Shafeek and Wesley Zaleena
Current Estimated Value
Purchase Details
Closed on
Oct 5, 2016
Sold by
Amphay
Bought by
Wesley Shafeek
Purchase Details
Closed on
Aug 26, 2009
Sold by
Wesley Clement N
Bought by
Wesley Shafeek and Phongsavath Amphay
Home Financials for this Owner
Home Financials are based on the most recent Mortgage that was taken out on this home.
Original Mortgage
$151,607
Interest Rate
5.19%
Purchase Details
Closed on
Sep 28, 2004
Sold by
D G Jenkins Dev Corp
Bought by
Wesley Shafeek and Wesley Clement
Home Financials for this Owner
Home Financials are based on the most recent Mortgage that was taken out on this home.
Original Mortgage
$152,859
Interest Rate
5.71%
Create a Home Valuation Report for This Property
The Home Valuation Report is an in-depth analysis detailing your home's value as well as a comparison with similar homes in the area
Home Values in the Area
Average Home Value in this Area
Purchase History
| Date | Buyer | Sale Price | Title Company |
|---|---|---|---|
| Wesley Shafeek | -- | -- | |
| Wesley Shafeek | -- | -- | |
| Wesley Shafeek | -- | -- | |
| Wesley Shafeek | $167,400 | -- |
Source: Public Records
Mortgage History
| Date | Status | Borrower | Loan Amount |
|---|---|---|---|
| Previous Owner | Wesley Shafeek | $151,607 | |
| Previous Owner | Wesley Shafeek | $152,859 |
Source: Public Records
Tax History Compared to Growth
Tax History
| Year | Tax Paid | Tax Assessment Tax Assessment Total Assessment is a certain percentage of the fair market value that is determined by local assessors to be the total taxable value of land and additions on the property. | Land | Improvement |
|---|---|---|---|---|
| 2025 | $4,399 | $164,200 | $50,000 | $114,200 |
| 2024 | $4,008 | $138,520 | $35,200 | $103,320 |
| 2023 | $4,008 | $138,520 | $35,200 | $103,320 |
| 2022 | $3,600 | $120,520 | $28,000 | $92,520 |
| 2021 | $3,122 | $95,320 | $24,000 | $71,320 |
| 2020 | $2,921 | $85,040 | $20,000 | $65,040 |
| 2019 | $2,835 | $85,040 | $20,000 | $65,040 |
| 2018 | $2,771 | $82,040 | $20,000 | $62,040 |
| 2016 | $2,619 | $74,040 | $17,360 | $56,680 |
| 2015 | $2,279 | $61,160 | $12,000 | $49,160 |
| 2014 | -- | $61,160 | $12,000 | $49,160 |
Source: Public Records
Map
Nearby Homes
- 812 Holly Meadow Dr
- 665 Roxford Ln Unit 3
- 3811 Roxfield Dr
- 3725 Roxwood Park Dr Unit 1
- 3805 Roxwood Park Dr Unit 1
- 3740 Crescent Walk Ln
- 3612 Brookefall Ct
- 3720 Crescent Walk Ln
- 3941 Oak Crossing Dr
- 3645 Hickory Branch Trail Unit 1
- 3998 Oak Crossing Dr NE
- 3929 Two Bridge Dr
- 3720 Brookefall Landing
- 515 Morning Creek Ln
- 3540 Hickory Branch Trail
- 407 Vista Lake Dr
- 189 Rutlidge Park Ln
- 3713 Lake Edge Dr
- 878 Roxholly Ln
- 838 Roxholly Ln
- 818 Roxholly Ln Unit 3
- 841 Holly Meadow Dr Unit 74
- 821 Holly Meadow Dr Unit 2
- 831 Holly Meadow Dr
- 898 Roxholly Ln
- 869 Roxholly Ln
- 808 Roxholly Ln
- 859 Roxholly Ln Unit 3
- 879 Roxholly Ln Unit 3
- 879 Roxholly Ln NE
- 849 Roxholly Ln
- 889 Roxholly Ln
- 798 Roxholly Ln
- 839 Roxholly Ln
- 829 Roxholly Ln
- 819 Roxholly Ln
- 819 Roxholly Ln Unit 3
- 811 Holly Meadow Dr Unit 2