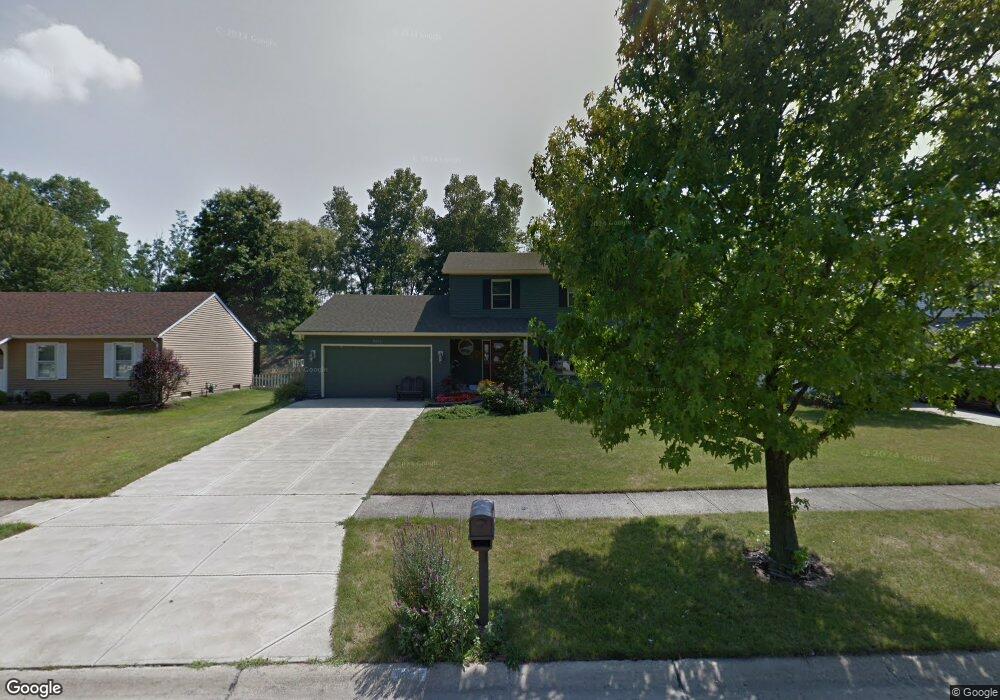
8582 Oakridge Dr Olmsted Falls, OH 44138
Estimated Value: $305,000 - $372,000
3
Beds
2
Baths
2,136
Sq Ft
$151/Sq Ft
Est. Value
About This Home
This home is located at 8582 Oakridge Dr, Olmsted Falls, OH 44138 and is currently estimated at $323,222, approximately $151 per square foot. 8582 Oakridge Dr is a home located in Cuyahoga County with nearby schools including Falls-Lenox Primary Elementary School, Olmsted Falls Intermediate Building, and Olmsted Falls Middle School.
Ownership History
Date
Name
Owned For
Owner Type
Purchase Details
Closed on
May 14, 1997
Sold by
Packard Cheryl K
Bought by
Mcmahon Dennis and Mcmahon Shelly H
Current Estimated Value
Home Financials for this Owner
Home Financials are based on the most recent Mortgage that was taken out on this home.
Original Mortgage
$95,000
Outstanding Balance
$13,316
Interest Rate
8.27%
Mortgage Type
New Conventional
Estimated Equity
$309,906
Purchase Details
Closed on
Oct 19, 1990
Sold by
Nieves Benjamin and Nieves Marylou
Bought by
Packard Cheryl K
Purchase Details
Closed on
Jun 28, 1984
Bought by
Nieves Benjamin and Nieves Marylou
Purchase Details
Closed on
Nov 28, 1983
Bought by
Bennett Contractors Inc
Purchase Details
Closed on
Jan 11, 1983
Bought by
Planterra Corp
Purchase Details
Closed on
Aug 27, 1981
Bought by
Womens Fed Sav& Loan Assoc
Purchase Details
Closed on
Dec 19, 1980
Bought by
Champion Equity Corp
Purchase Details
Closed on
Jan 1, 1980
Bought by
Lifetime Homes Inc
Create a Home Valuation Report for This Property
The Home Valuation Report is an in-depth analysis detailing your home's value as well as a comparison with similar homes in the area
Home Values in the Area
Average Home Value in this Area
Purchase History
| Date | Buyer | Sale Price | Title Company |
|---|---|---|---|
| Mcmahon Dennis | $136,000 | -- | |
| Packard Cheryl K | $105,000 | -- | |
| Nieves Benjamin | $85,000 | -- | |
| Bennett Contractors Inc | -- | -- | |
| Planterra Corp | -- | -- | |
| Womens Fed Sav& Loan Assoc | -- | -- | |
| Champion Equity Corp | -- | -- | |
| Lifetime Homes Inc | -- | -- |
Source: Public Records
Mortgage History
| Date | Status | Borrower | Loan Amount |
|---|---|---|---|
| Open | Mcmahon Dennis | $95,000 |
Source: Public Records
Tax History Compared to Growth
Tax History
| Year | Tax Paid | Tax Assessment Tax Assessment Total Assessment is a certain percentage of the fair market value that is determined by local assessors to be the total taxable value of land and additions on the property. | Land | Improvement |
|---|---|---|---|---|
| 2024 | $6,972 | $92,645 | $15,540 | $77,105 |
| 2023 | $6,621 | $71,580 | $13,410 | $58,170 |
| 2022 | $6,573 | $71,580 | $13,410 | $58,170 |
| 2021 | $6,484 | $71,230 | $13,410 | $57,820 |
| 2020 | $6,158 | $59,850 | $11,270 | $48,580 |
| 2019 | $5,586 | $171,000 | $32,200 | $138,800 |
| 2018 | $5,095 | $59,850 | $11,270 | $48,580 |
| 2017 | $4,850 | $49,740 | $10,430 | $39,310 |
| 2016 | $4,827 | $49,740 | $10,430 | $39,310 |
| 2015 | $4,777 | $49,740 | $10,430 | $39,310 |
| 2014 | $4,777 | $48,310 | $10,120 | $38,190 |
Source: Public Records
Map
Nearby Homes
- 26680 Village Ln
- 9050 Ashwood Ct
- 9100 Ashwood Ct
- 8793 Usher Rd
- 8408 Brentwood Dr
- 9111 Devonshire Dr
- 26856 Bagley Rd
- 26471 Bayfair Dr
- 9394 Basswood Dr
- 26476 Locust Dr
- 26332 Redwood Dr
- 9422 Driftwood Dr
- 9459 Central Park Blvd
- 9425 Ravinia Dr
- 8665 Westfield Park Dr
- 26724 Lake of the Falls Blvd
- 26739 Lake of the Falls Blvd
- 6671 Laurel Ln Unit 142
- 26633 Lake of the Falls Blvd
- 8883 Holly Ln Unit 32
- 8586 Oakridge Dr
- 8578 Oakridge Dr
- 8590 Oakridge Dr
- 8574 Oakridge Dr
- 8594 Oakridge Dr
- 8570 Oakridge Dr
- 8581 Oakridge Dr
- 8585 Oakridge Dr
- 8577 Oakridge Dr
- 8598 Oakridge Dr
- 8589 Oakridge Dr
- 8566 Oakridge Dr
- 8573 Oakridge Dr
- 8569 Oakridge Dr
- 8602 Oakridge Dr
- 8562 Oakridge Dr
- 8597 Oakridge Dr
- 8565 Oakridge Dr
- 8558 Greenbriar Dr
- 8606 Oakridge Dr