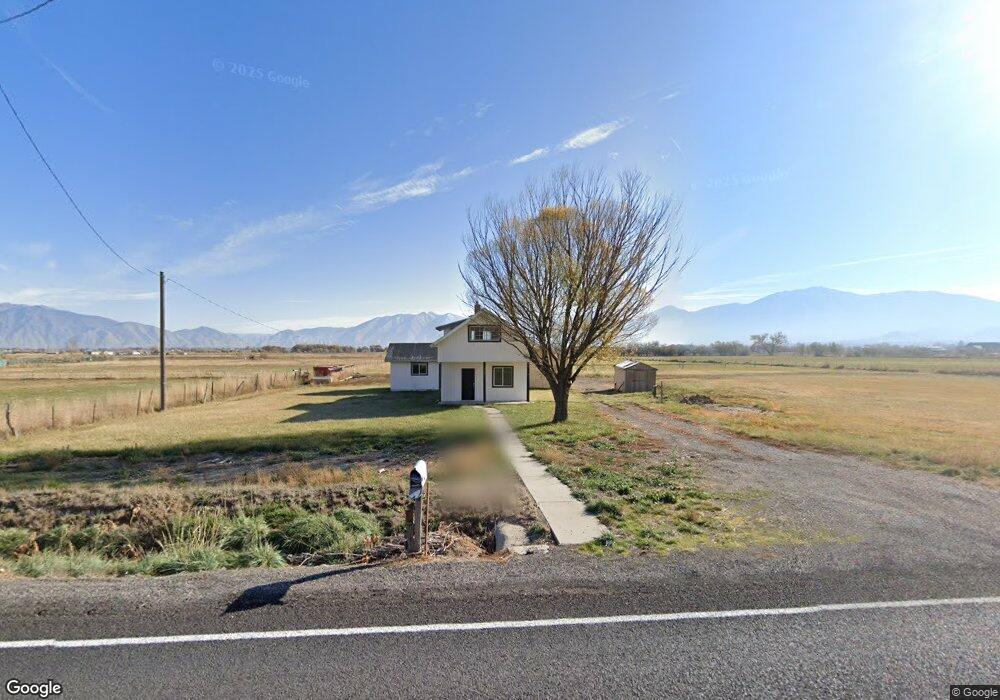
8587 S 5600 W Payson, UT 84651
Estimated Value: $778,000 - $1,169,748
3
Beds
1
Bath
1,472
Sq Ft
$698/Sq Ft
Est. Value
About This Home
This home is located at 8587 S 5600 W, Payson, UT 84651 and is currently estimated at $1,027,687, approximately $698 per square foot. 8587 S 5600 W is a home located in Utah County with nearby schools including Taylor Elementary School, Mt. Nebo Junior High School, and Salem Junior High School.
Ownership History
Date
Name
Owned For
Owner Type
Purchase Details
Closed on
Jul 1, 2020
Sold by
Mize M Aloha and The Mize Family Trust
Bought by
Piceno Benjamin Leyva
Current Estimated Value
Home Financials for this Owner
Home Financials are based on the most recent Mortgage that was taken out on this home.
Original Mortgage
$300,000
Outstanding Balance
$266,020
Interest Rate
3.1%
Mortgage Type
New Conventional
Estimated Equity
$761,667
Purchase Details
Closed on
Nov 1, 2019
Sold by
Zonts Joshua and Zonts Kathleen Ann
Bought by
Mize M Aloha and The Mize Family Trust
Purchase Details
Closed on
Nov 7, 2017
Sold by
Mize M Aloha and Mize Family Trust
Bought by
Zonts Joshua and Zonts Kathleen Ann
Home Financials for this Owner
Home Financials are based on the most recent Mortgage that was taken out on this home.
Original Mortgage
$367,000
Interest Rate
3.91%
Mortgage Type
Purchase Money Mortgage
Purchase Details
Closed on
Mar 30, 2000
Sold by
Mize M Aloha
Bought by
Mize M Aloha
Create a Home Valuation Report for This Property
The Home Valuation Report is an in-depth analysis detailing your home's value as well as a comparison with similar homes in the area
Home Values in the Area
Average Home Value in this Area
Purchase History
| Date | Buyer | Sale Price | Title Company |
|---|---|---|---|
| Piceno Benjamin Leyva | -- | Old Republic Title Co | |
| Mize M Aloha | $372,453 | Provo Land Title Company | |
| Zonts Joshua | -- | North American Title | |
| Mize M Aloha | -- | North American Title | |
| Mize M Aloha | -- | -- |
Source: Public Records
Mortgage History
| Date | Status | Borrower | Loan Amount |
|---|---|---|---|
| Open | Piceno Benjamin Leyva | $300,000 | |
| Previous Owner | Zonts Joshua | $367,000 |
Source: Public Records
Tax History Compared to Growth
Tax History
| Year | Tax Paid | Tax Assessment Tax Assessment Total Assessment is a certain percentage of the fair market value that is determined by local assessors to be the total taxable value of land and additions on the property. | Land | Improvement |
|---|---|---|---|---|
| 2025 | $5,876 | $634,715 | $596,500 | $220,600 |
| 2024 | $5,876 | $587,395 | $0 | $0 |
| 2023 | $5,828 | $583,050 | $0 | $0 |
| 2022 | $6,060 | $740,200 | $605,700 | $134,500 |
| 2021 | $4,552 | $497,100 | $396,000 | $101,100 |
| 2020 | $4,199 | $445,700 | $344,600 | $101,100 |
| 2019 | $3,115 | $351,200 | $259,300 | $91,900 |
| 2018 | $3,035 | $319,200 | $239,300 | $79,900 |
| 2017 | $2,922 | $227,180 | $0 | $0 |
| 2016 | $2,771 | $208,865 | $0 | $0 |
| 2015 | $2,735 | $204,465 | $0 | $0 |
| 2014 | $2,733 | $204,465 | $0 | $0 |
Source: Public Records
Map
Nearby Homes
- 5959 W 8000 S
- 9054 S 6200 W
- 8982 S 4800 W
- 4050 W 9600 S
- 10336 S 6000 W
- 9337 S 3950 W
- 5132 W 10400 S
- 310 N 1500 W
- 9284 S 3550 W
- 10900 S 5200 W
- 9672 S 3550 W
- 384 W 650 N Unit A-D
- 383 W 625 N Unit A-D
- 361 W 625 N Unit A-D
- 500 900 N
- 600 900 N
- 219 S Majestic W
- 607 N 125 W
- 841 N Dryland Cir Unit BALLAR
- 841 N Dryland Cir Unit DREXEL
- 8568 S 5600 W
- 8536 S 5600 W
- 8603 S 5600 W
- 8525 S 5600 W Unit 1
- 8602 S 5600 W
- 8626 S 5600 W
- 5581 W 8400 S
- 5535 W 8400 S
- 5560 W 8800 S Unit 6
- 5560 W 8800 S Unit 7
- 5576 W 8800 S
- 5576 W 8800 S Unit 2
- 5542 W 8400 S
- 5479 W 8400 S
- 8382 S 5600 W
- 5699 W 8400 S
- 5544 W 8800 S
- 8811 S 5600 W
- 5468 W 8800 S Unit 3
- 5468 W 8800 S