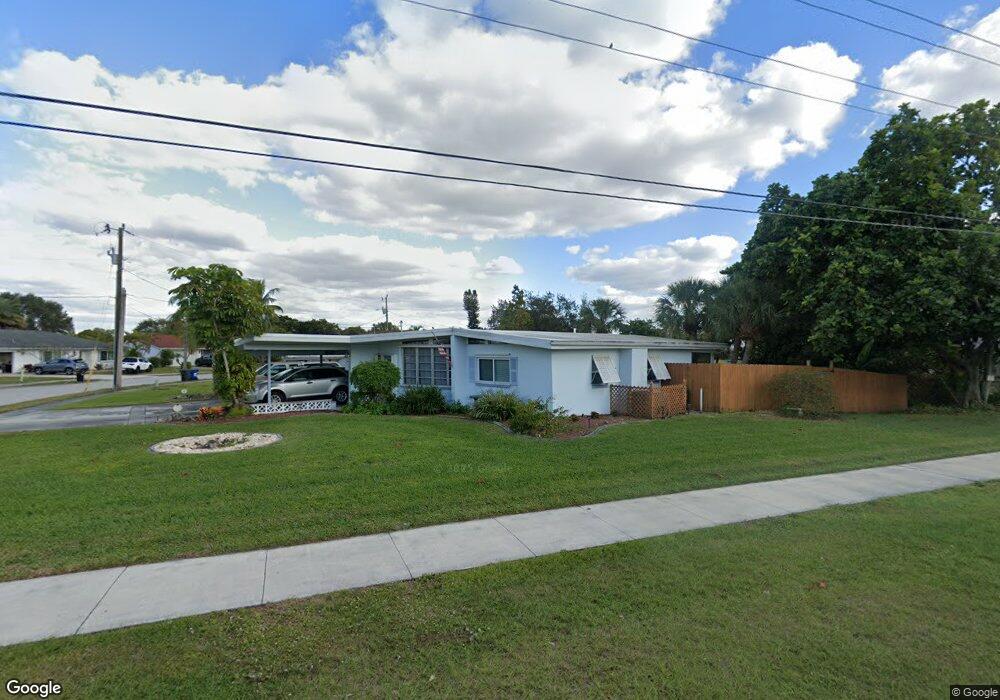
859 Hydrangea Dr North Fort Myers, FL 33903
Hancock NeighborhoodEstimated Value: $216,000 - $354,000
3
Beds
2
Baths
1,218
Sq Ft
$211/Sq Ft
Est. Value
About This Home
This home is located at 859 Hydrangea Dr, North Fort Myers, FL 33903 and is currently estimated at $257,287, approximately $211 per square foot. 859 Hydrangea Dr is a home located in Lee County with nearby schools including Tropic Isles Elementary School, Hancock Creek Elementary School, and Caloosa Elementary School.
Ownership History
Date
Name
Owned For
Owner Type
Purchase Details
Closed on
Jun 24, 2013
Sold by
The John M Roach Living Trust
Bought by
Roach John M
Current Estimated Value
Home Financials for this Owner
Home Financials are based on the most recent Mortgage that was taken out on this home.
Original Mortgage
$111,513
Outstanding Balance
$82,718
Interest Rate
4.48%
Mortgage Type
New Conventional
Estimated Equity
$174,569
Purchase Details
Closed on
Jul 15, 2011
Sold by
Roach John M
Bought by
The John M Roach Living Trust
Purchase Details
Closed on
May 29, 1998
Sold by
Franks Billy Eugene and Franks Dixie Lee
Bought by
Roach John M
Home Financials for this Owner
Home Financials are based on the most recent Mortgage that was taken out on this home.
Original Mortgage
$57,950
Interest Rate
7.15%
Create a Home Valuation Report for This Property
The Home Valuation Report is an in-depth analysis detailing your home's value as well as a comparison with similar homes in the area
Home Values in the Area
Average Home Value in this Area
Purchase History
| Date | Buyer | Sale Price | Title Company |
|---|---|---|---|
| Roach John M | -- | Advantage Title Company Llc | |
| The John M Roach Living Trust | -- | None Available | |
| Roach John M | $61,000 | -- |
Source: Public Records
Mortgage History
| Date | Status | Borrower | Loan Amount |
|---|---|---|---|
| Open | Roach John M | $111,513 | |
| Closed | Roach John M | $57,950 |
Source: Public Records
Tax History Compared to Growth
Tax History
| Year | Tax Paid | Tax Assessment Tax Assessment Total Assessment is a certain percentage of the fair market value that is determined by local assessors to be the total taxable value of land and additions on the property. | Land | Improvement |
|---|---|---|---|---|
| 2025 | $1,166 | $118,713 | -- | -- |
| 2024 | $1,111 | $115,367 | -- | -- |
| 2023 | $1,111 | $112,007 | $0 | $0 |
| 2022 | $1,540 | $108,745 | $0 | $0 |
| 2021 | $1,471 | $158,785 | $55,372 | $103,413 |
| 2020 | $1,469 | $104,120 | $0 | $0 |
| 2019 | $1,436 | $101,779 | $0 | $0 |
| 2018 | $1,418 | $99,881 | $0 | $0 |
| 2017 | $1,410 | $97,827 | $0 | $0 |
| 2016 | $1,297 | $95,815 | $32,710 | $63,105 |
| 2015 | $1,608 | $81,300 | $30,129 | $51,171 |
| 2014 | $760 | $76,594 | $27,972 | $48,622 |
| 2013 | -- | $61,400 | $25,553 | $35,847 |
Source: Public Records
Map
Nearby Homes
- 847 Hydrangea Dr
- 4930 Orange Grove Blvd
- 938 Tropical Palm Ave
- 992 Tropical Palm Ave
- 950 Lakeview Dr
- 927 Coconut Dr
- 9439 Palm Island Cir
- 13421 Wild Cotton Ct
- 897 Iris Dr
- 13460 Wild Cotton Ct
- 860 Camellia Dr
- 9346 Palm Island Cir
- 857 Pangola Dr
- 947 Jolly Rd
- 13362 Queen Palm Run
- 13358 Queen Palm Run
- 935 Hearty St
- 13317 Queen Palm Run
- 995 April Ln
- 0 Happy Dale Rd Unit 2025008482
- 847R Hydrangea Dr
- 860 Hydrangea Dr
- 837 Hydrangea Dr
- 854 Hydrangea Dr
- 4951 Orange Grove Blvd
- 4945 Orange Grove Blvd
- 848 Hydrangea Dr
- 4939 Orange Grove Blvd
- 842 Hydrangea Dr
- 4924 Orange Grove Blvd
- 4957 Orange Grove Blvd
- 836 Hydrangea Dr
- 4931 Orange Grove Blvd
- 989 Iris Dr
- 4963 Orange Grove Blvd
- 831 Hydrangea Dr Unit 2
- 4918 Orange Grove Blvd
- 944 Tropical Palm Ave
- 830 Hydrangea Dr
- 950 Tropical Palm Ave