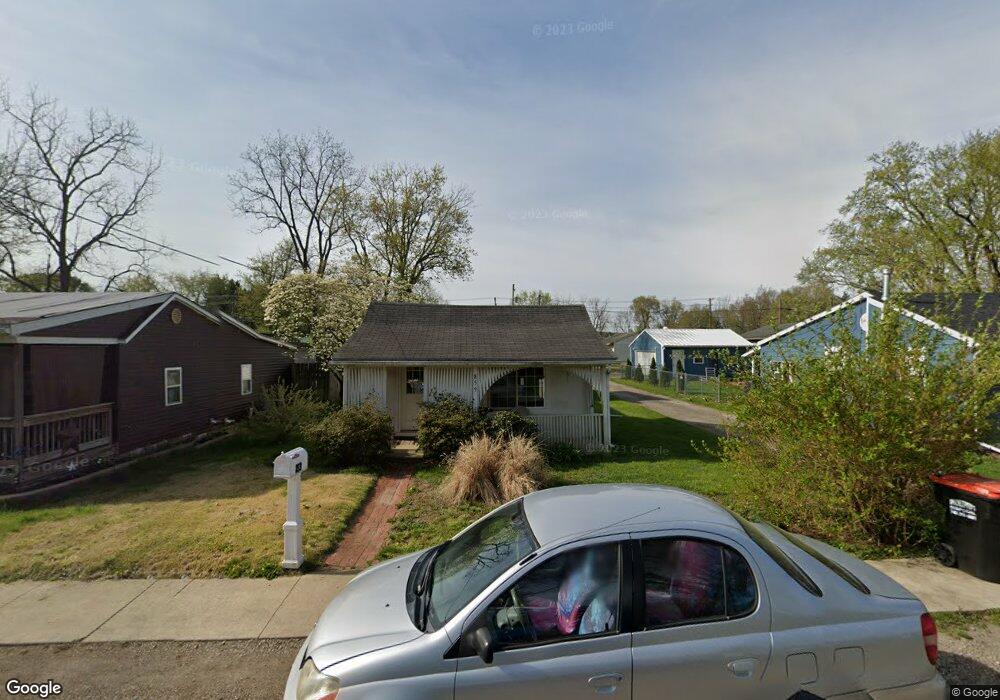
859 Jones Ave Newark, OH 43055
Estimated Value: $136,000 - $170,000
2
Beds
1
Bath
840
Sq Ft
$180/Sq Ft
Est. Value
About This Home
This home is located at 859 Jones Ave, Newark, OH 43055 and is currently estimated at $151,056, approximately $179 per square foot. 859 Jones Ave is a home located in Licking County with nearby schools including Carson Elementary School, Heritage Middle School, and Newark High School.
Ownership History
Date
Name
Owned For
Owner Type
Purchase Details
Closed on
Oct 28, 2024
Sold by
Synergy Realty Group Llc
Bought by
Traction Real Estate Holdings Llc
Current Estimated Value
Home Financials for this Owner
Home Financials are based on the most recent Mortgage that was taken out on this home.
Original Mortgage
$127,500
Outstanding Balance
$126,328
Interest Rate
6.54%
Mortgage Type
New Conventional
Estimated Equity
$24,728
Purchase Details
Closed on
Mar 25, 2024
Sold by
Barton Troy L and Barton Atarah L
Bought by
Synergy Realty Group
Home Financials for this Owner
Home Financials are based on the most recent Mortgage that was taken out on this home.
Original Mortgage
$97,000
Interest Rate
6.77%
Mortgage Type
Construction
Purchase Details
Closed on
Dec 28, 2023
Sold by
Sweazy Lorena S
Bought by
Barton Troy L and Barton Atarah L
Create a Home Valuation Report for This Property
The Home Valuation Report is an in-depth analysis detailing your home's value as well as a comparison with similar homes in the area
Home Values in the Area
Average Home Value in this Area
Purchase History
| Date | Buyer | Sale Price | Title Company |
|---|---|---|---|
| Traction Real Estate Holdings Llc | -- | Landsel Title | |
| Synergy Realty Group | $51,000 | None Listed On Document | |
| Barton Troy L | -- | None Listed On Document |
Source: Public Records
Mortgage History
| Date | Status | Borrower | Loan Amount |
|---|---|---|---|
| Open | Traction Real Estate Holdings Llc | $127,500 | |
| Previous Owner | Synergy Realty Group | $97,000 |
Source: Public Records
Property History
| Date | Event | Price | List to Sale | Price per Sq Ft |
|---|---|---|---|---|
| 12/28/2024 12/28/24 | Off Market | $1,350 | -- | -- |
| 11/25/2024 11/25/24 | Price Changed | $1,350 | -3.6% | $2 / Sq Ft |
| 11/15/2024 11/15/24 | For Rent | $1,400 | -- | -- |
Tax History Compared to Growth
Tax History
| Year | Tax Paid | Tax Assessment Tax Assessment Total Assessment is a certain percentage of the fair market value that is determined by local assessors to be the total taxable value of land and additions on the property. | Land | Improvement |
|---|---|---|---|---|
| 2024 | $1,095 | $30,590 | $9,310 | $21,280 |
| 2023 | $1,093 | $30,590 | $9,310 | $21,280 |
| 2022 | $1,047 | $26,040 | $5,180 | $20,860 |
| 2021 | $1,098 | $26,040 | $5,180 | $20,860 |
| 2020 | $1,123 | $26,040 | $5,180 | $20,860 |
| 2019 | $848 | $18,900 | $3,990 | $14,910 |
| 2018 | $848 | $0 | $0 | $0 |
| 2017 | $813 | $0 | $0 | $0 |
| 2016 | $712 | $0 | $0 | $0 |
| 2015 | $727 | $0 | $0 | $0 |
| 2014 | $931 | $0 | $0 | $0 |
| 2013 | $692 | $0 | $0 | $0 |
Source: Public Records
Map
Nearby Homes
- 934 Garfield Ave
- 87 Liberty Ave
- 952 Emerson St
- 688 Russell Ave
- 554 Garfield Ave
- 240 N Wing St
- 491 Garfield Ave
- 81 Madison Ave
- 483 Allston Ave
- 506 Lexington Ave
- 424 Ridge Ave
- 76 Oakwood Ave
- 460 Allston Ave
- 61 Rosebud Ave
- 167 Essex St
- 160 N Cedar St
- 430 E Main St
- 452 Walnut Ln
- 51 Mill St
- 0 Swans Rd NE
- 863 Jones Ave
- 851 Jones Ave
- 839 Jones Ave
- 875 Jones Ave
- 850 Jones Ave
- 862 Jones Ave
- 870 Linwood Ave
- 854 Linwood Ave
- 868 Linwood Ave
- 874 Linwood Ave
- 838 Linwood Ave
- 835 Jones Ave
- 879 Jones Ave
- 880 Linwood Ave
- 887 Jones Ave
- 863 Garfield Ave
- 831 Jones Ave
- 832 Linwood Ave
- 855 Garfield Ave
- 873 Garfield Ave