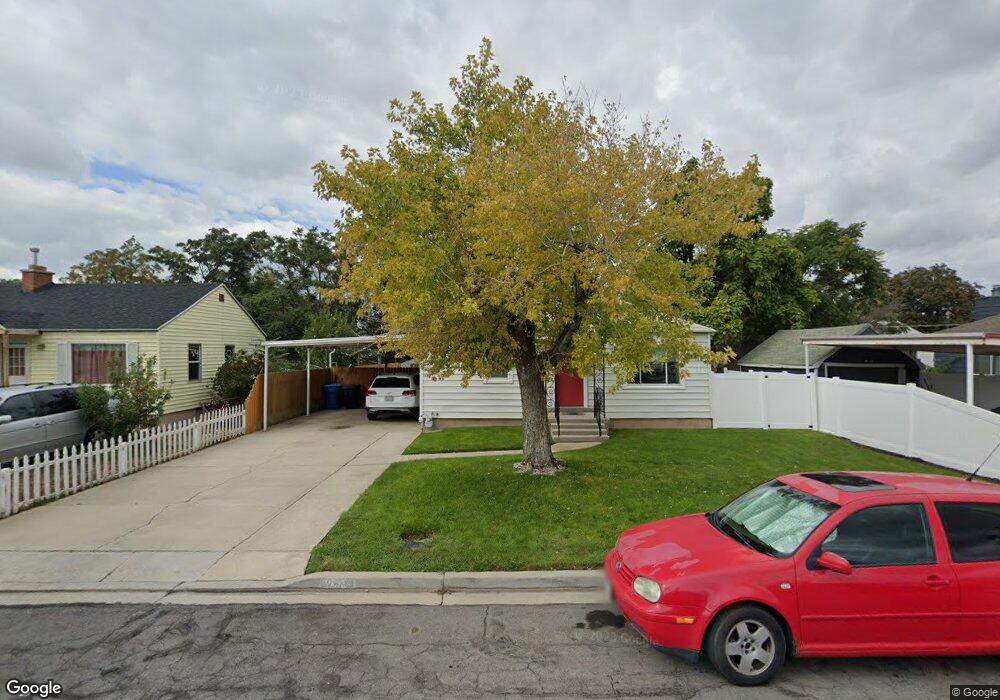
859 N 275 E Orem, UT 84057
Windsor NeighborhoodEstimated Value: $425,000 - $452,000
4
Beds
2
Baths
1,860
Sq Ft
$236/Sq Ft
Est. Value
About This Home
This home is located at 859 N 275 E, Orem, UT 84057 and is currently estimated at $438,928, approximately $235 per square foot. 859 N 275 E is a home located in Utah County with nearby schools including Orchard Elementary School, Canyon View Junior High School, and Timpanogos High School.
Ownership History
Date
Name
Owned For
Owner Type
Purchase Details
Closed on
Feb 20, 2009
Sold by
Abel Brian C and Abel Denise M
Bought by
Dale Jannica J
Current Estimated Value
Home Financials for this Owner
Home Financials are based on the most recent Mortgage that was taken out on this home.
Original Mortgage
$160,047
Outstanding Balance
$101,061
Interest Rate
5.08%
Mortgage Type
FHA
Estimated Equity
$337,867
Purchase Details
Closed on
Aug 6, 1999
Sold by
Johnson Neil B and Johnson Suzanne P
Bought by
Abel Brian C and Abel Denise M
Home Financials for this Owner
Home Financials are based on the most recent Mortgage that was taken out on this home.
Original Mortgage
$112,175
Interest Rate
7.64%
Mortgage Type
FHA
Create a Home Valuation Report for This Property
The Home Valuation Report is an in-depth analysis detailing your home's value as well as a comparison with similar homes in the area
Home Values in the Area
Average Home Value in this Area
Purchase History
| Date | Buyer | Sale Price | Title Company |
|---|---|---|---|
| Dale Jannica J | -- | First American Union Park | |
| Abel Brian C | -- | Timp Title Insurance Agency |
Source: Public Records
Mortgage History
| Date | Status | Borrower | Loan Amount |
|---|---|---|---|
| Open | Dale Jannica J | $160,047 | |
| Previous Owner | Abel Brian C | $112,175 |
Source: Public Records
Tax History
| Year | Tax Paid | Tax Assessment Tax Assessment Total Assessment is a certain percentage of the fair market value that is determined by local assessors to be the total taxable value of land and additions on the property. | Land | Improvement |
|---|---|---|---|---|
| 2025 | $1,561 | $207,350 | -- | -- |
| 2024 | $1,561 | $190,850 | $0 | $0 |
| 2023 | $1,413 | $185,735 | $0 | $0 |
| 2022 | $1,531 | $194,975 | $0 | $0 |
| 2021 | $1,313 | $253,300 | $123,100 | $130,200 |
| 2020 | $1,193 | $226,100 | $98,500 | $127,600 |
| 2019 | $1,094 | $215,700 | $89,000 | $126,700 |
| 2018 | $1,007 | $189,600 | $79,400 | $110,200 |
| 2017 | $952 | $96,030 | $0 | $0 |
| 2016 | $807 | $75,075 | $0 | $0 |
| 2015 | $853 | $75,075 | $0 | $0 |
| 2014 | $853 | $74,690 | $0 | $0 |
Source: Public Records
Map
Nearby Homes
Your Personal Tour Guide
Ask me questions while you tour the home.